Setting up at Polka Theatre, Wimbledon

I am in the foyer of the much loved Polka Children’s Theatre setting up The Prediction Machine and weather station for their Techtopia festival which is opening on Thursday 24th May. It is another heatwave continuing a wave of strange weather in the UK so far this year.

The weather station is on a pole attached to the fence in the garden tracking the day as it heats up. It is 11.14am and is saying 24 degrees celsius outside in the garden. The temperature gauge may be too much in direct sunlight so the readings are possibly a bit high – the weather report is more like 21 degrees celsius, it’s hard to keep the temperature away from the sunlight but also have the wind and rain away from shelter in this spot – I will keep tweaking it over the next couple of days before the festival opening.

I am also preparing for a workshop with two local school groups. We will be building a ‘Future Machine’ using electronic devices, a weather station and by thinking about weather, climate, the environment and what kind of future we would like to live in.

The machines are due to arrive at 1pm so we will get them set up this afternoon!

Look here to see what the live weather station is at Polka Theatre!

weather sensors (temperature, wind, rain) on a pole outside the Polka Theatre


Techtopia, Polka Childrens Theatre 24th May – 3rd June

The Prediction Machine will be exhibited as part of Techtopia at Polka Childrens Theatre in Wimbledon, London from 24th May – 3rd June.

Adapted for a younger audience the machines are set up in the foyer (as part of the festivals free events) and a weather station is set up in the garden.

2 schools workshops will be taking place on Friday 25th May exploring how we capture weather and climate data, building a ‘Future Machine’ that helps us understand how the environment and climate is changing as the future unfolds.

https://polkatheatre.com/event/techtopia-free-events/

Climate Change, Uncertainty and Predicting the Future Talk and Q&A

graph showing 150,000 years of temperature  and CO2 from ice core from the Antartica with a finger pointing at when the steam engine was inventing and the increase to 400ppm CO2

Friday 9th February, Cambridge Central Library, 7 Lions Yard 11am – 12pm

As part of the exhibition at Cambridge Central Library there will be a talk and discussion event looking at the themes of climate change, uncertainty and predicting the future.

Come along to meet the artist Rachel Jacobs and Dr John King, Senior Scientist at the British Antarctic Survey and join a discussion about the future, uncertainty, climate change and the polar regions. This event is hosted by Cambridge Carbon Footprint and Cambridge Central Library.

Event is free to attend but please book a seat here in advance:
http://cambridgecarbonfootprint.org/events/climate-change-uncertainty/

Rachel Jacobs has been working with Senior Scientists John King and Robert Mulvaney, alongside Matthew Polaine and Beatrix Schlarb-Ridley from the innovation team at the British Antarctic Survey to explore how we can communicate and understand issues of uncertainty, climate change, the polar regions and their impact on our everyday lives as part of her most recent arts/research project – Performing the Future.

Preparing for Cambridge Central Library Exhibition

The Prediction Machine and Promises Machine are currently being tested and set up to be exhibited at Cambridge Central Library from Saturday 3rd – Sunday 18th February. This latest tour is part of wider project called Performing the Future and as part of this I have been developing a new (virtual) machine called The Future Machine.

You can join the Future Machine when you submit a promise at the exhibition, your promise is then recorded online and you will be invited to make updates on how you are keeping your promise, or change your promise and also act as a witness to the future as it unfolds by taking part in activities that are taking place around the UK. Every year for the duration of the project you will also receive a gift in the post, a message from the future that will help us build the Future Machine together.

As part of the exhibition there will be two parallel public events. Firstly I will be running a workshop with the ‘Not Quite Over the Hill’ community group in Arbury in Cambridge, where we will be writing predictions based on different weather scenarios and creating  data visualisations using multi-coloured felt.  Secondly as a result of the Performing the Future workshop that took place at the British Antarctic Survey with senior scientists John King and Robert Mulvaney we will be doing a talk and discussion event at the library on Friday 9th Feb to continue the conversations we started in the workshop about how we can understand scientific uncertainty and climate change in the polar regions and how this relates to our everyday lives – this is likely to be an interesting discussion!

The Prediction Machine being prepared in my artist's studio in Nottingham


The Prediction Machine at Cambridge Central Library

February 3rd – 18th 2018

The Prediction Machine is going to Cambridge Central Library as part of the latest tour and will be installed on the first floor next to the reception area. Alongside the exhibition workshops are due to be taking place with a local community group and school (details to be confirmed. There will also be a free discussion and Q&A event with the artist Rachel Jacobs and Dr John King from the British Antarctic Survey (details to be announced soon).

The latest tour and workshops are put of a larger project ‘Performing the Future’ which is funded by the Arts Council of England and Mixed Reality Lab, University of Nottingham.

Cambridge Central Library is wheelchair friendly, for more information about the venue and access please visit their website:
https://www.cambridgeshire.gov.uk/central-library-cambridge/

For more information about the accessibility of the artwork view our accessibility policy: https://www.thepredictionmachine.org/accessibility-policy-and-information/

The New Observatory at FACT

weather station on the balcony at FACT

Some exciting new developments are happening for The Prediction Machine’s return to FACT in Liverpool this summer (2017) as part of The New Observatory Exhibition, an exciting 3 month exhibition looking at data and observation, curated by Sam Skinner and Hannah Redler Hawes.

The Prediction Machine team are working on some new developments for the machines, that are supported by my new work looking at ‘envisioning positive futures’. As part of this I am working with Dominic Price from Horizon Digital Economy Institute to build the ‘Future Machine’ that people can join by using the Promises Machine. They will be invited to make a promise that they are happy to commit to for the future and then sign up to the network to revisit this promise, see whether their prediction is coming true and join in on a discussion about the changes we observe as the future unfolds.

As part of the exhibition I will also be running workshops with FACT’s Over 60s mens group and students from the Observatory School in Birkenhead, more to come soon on this…

Visit FACT’s website for more information about the opening event and the rest of the exhibition:

http://www.fact.co.uk/projects/the-new-observatory.aspx

The New Observatory Exhibition at FACT, Liverpool

June 22nd – October 1st 2017
The Prediction Machine is returning to FACT, Liverpool as part of The New Observatory Exhibition. The machines will be exhibited with a few new additions including opportunities to sign up to receive updates about your predictions. Workshops will be taking place alongside the exhibition, returning to work with the Over 60s group based at FACT and working with a local school.

The Performing Data Project Makers Workshop

Thursday 16th and Friday 17th July 2015

Artists and Creative Technologists: We can help you quickly hack together and prototype new interactive artwork using live data streams.

At the Makers Workshop you’ll see examples from our collaborating digital artists, get your hands on our tools, and start experimenting for yourself, under our expert guidance, using real live scientific data. Then take away what you’ve learned; plugin to existing, or generate new data streams; and go build your own projects.

Tropixel, Ubatuba, Brazil

The mobile weather station attached to a sign on Ubatuba beach
http://tropixel.ubalab.org/en

The Prediction Machine and Performing Data was presented at Tropixel Festival Ceincia Aberta Ubatuba (Open Science), as part of the Mata Atlantica Festival celebrations July 3rd – 5th in Ubatuba, Sao Paulo, Brazil.

As part of this exciting week of workshops, talks, presentations and conversations I conducted an informal workshop that shows what happens behind the scenes with The Prediction Machine and presented the Performing Data Toolkit as a way to make experiments with live data streams. It was an opportunity to play with climate, weather and wave data.

We set up our mobile weather station on a sign by the beach behind the cultural centre where the workshop took place and started bringing the data into the Performing Data WordPress Plugin (Timestreams). We then started hacking the technology that runs The Prediction Machine so that it worked in Portuguese and responded to the weather and climate in Ubatuba.

The participants also made their own interpretations of the weather data we were collecting and made two performative installations – a music box that responded to the wind data and a shower that only worked when it rained and in response to the rainfall data – this was particularly relevant as there is an ongoing drought in Sao Paulo state.

As part of this event I also spoke on a panel about open science. Tropixel is part of the open software and hackers movement in Brazil and this event linked with the Open and Collaborative Science Network in Brazil.

I presented demos of the Performing data wordpress plug-in that powers The Prediction Machine, small arduino examples that are controlled by live weather data from a weather station set up for the workshop, and the Hasting Pier Yun that brought wave data from the UK to the waves of Brazil.

FACT Liverpool, Thursday 16th – Sunday 26th July

The Prediction Machine will be exhibited at FACT, Liverpool as part of the Build Your Own Programme alongside The Performing Data Project, alongside the other artists work who are collaborating on the Performing Data Project: http://performingdata.wp.horizon.ac.uk

Presentations and a reception to open the exhibition will take place on Thursday 16th July.

The Performing Data Project will be running a makers workshop on Friday 17th July where artists and hackers can get their hands dirty playing with weather, climate and wave data. Visit FACT’s website for more information.

Next steps

The top of The Prediction Machine and Promises and Wishes Machine at Nottingham Contemporary

The exhibition at Nottingham Contemporary is now over after an exciting couple of weeks, showing alongside of the wonderful and enlightening Rights of Nature exhibition and in my home town of Nottingham.

Approximately 400 people interacted directly with The Prediction Machine during the exhibition, cranking the machine and getting their predictions printed out. We also received just under 100 promises and wishes from the new ‘Promises and Wishes Machine’ which ranged from funny, sad, hopeful and apocalyptic.

The next steps for the project is to start an analysis of the interviews, observations and interactions with the machines as part of the Performing Data research. Negotiations are also taking place for future exhibitions, building a new phase of the project that focuses on longer term engagement with communities, hopefully in rural and coastal regions of the UK.

If you missed The Prediction Machine at Nottingham Contemporary it will be showing for one day only at the University of Nottingham’s Mayfest:https://www.nottingham.ac.uk/mayfest/index.aspx

Predictions and Promises in Nottingham

The Prediction Machine and the Promises and Wishes Machine installed in the window with a stand with instructions and
The Prediction Machine is now live at Nottingham Contemporary, there seems to be getting lots of people using it and good feedback. When myself or Noel (who is assisting the technical set up) have been in the gallery people have been waiting to use it and watching other people.

The new Promises and Wishes Machine is also now installed and we have been getting some great promises, wishes and predictions being sent, which I am turning into predictions that are being added to the machine throughout the exhibition. These include promises to ride bikes more, give up eating Macdonalds, wishes that the sun had a face, that people can still sit outside and for decent knitwear. The most moving response for me so far has been ‘I think i won’t be there’…

Thank you to all the visitors who have contributed their promises, wishes and predictions so far.

The top of the Promises and Wishes Machine  with a screen and a sign saying 'Promises'

Promises and Wishes

sketch of the promises and wishes machine

As part of the next exhibition – at Nottingham Contemporary – a new companion piece to The Prediction Machine is being developed. This is a ‘Promises and Wishes’ machine, that allows visitors to type in the webcode at the bottom of their prediction and send a promise, wish or prediction of their own back to the machine. They will also be able to view some of the scientific data that is being used by the machine to inform the predictions and find out more about how this is done.

Nottingham Contemporary 3rd – 15th March

Exhibition at Nottingham Contemporary,
Tuesday 3rd – Sunday 15th March

The Prediction Machine will be exhibited alongside the ‘Rights of Nature’ exhibition. As part of this exhibition visitors will also be able to add their own promises, wishes and predictions to the machine.

Please note that from Tuesday 3rd – Sunday 8th March the machine will be installed on the stairs and unfortunately will not be accessible via the lift. From Monday 9th March – Sunday 15th March the machine will be installed on Level 1 outside the cafe and will be fully accessible.

Please contact the venue for further information.

http://www.nottinghamcontemporary.org/event/prediction-machine

The Prediction Machine… Winter Predictions for 2044

The Prediction Machine will be presented in Nottingham on Saturday December 6th between 1.30 and 5pm at the Primary Studios Christmas Fayre.

Come along to visit the machine and get your prediction for winter 2044… will it snow at christmas or will their be a heatwave?

http://www.weareprimary.org/2014/11/xmasfayre/ – find details of Primary Studios and the event here.

The Prediction Machine’s Climate-Change-Harvest-Festival

the screen with a face on it and the sign with blue skies and trees in the background
The Prediction Machine’s Climate-Change-Harvest-Festival
Sunday 26th October
, 2-4pm 
The Shed, Margaret Keay Road, University of Loughborough
 
Come along for some seasonal food, make a wish for the future and take part in a thank you to everyone that has contributed to or visited The Prediction Machine as part of Radar’s Nowcasting Programme. 
 
The event is an alternative Harvest-Diwali Festival in appreciation of the seasons changing over this (so far) very warm Autumn.
 
Anyone is welcome.
 

Accessibility Policy and Information

The Prediction Machine and website is being created with accessibility in mind. The machine will develop over several phases and will be adapted as it is built, exhibited and then toured. We welcome any feedback about making the machine and website accessibility which can be sent via twitter to: @hello_tree

This website is targeted at basic level (A) standard accessibility and we are aiming to improve as the project grows over the next year.

The artwork is a sensory experience involving a combination of sound, visuals and text. Additional large print information and instructions will be available during the exhibition and the artist will provide guides to the artwork on specific days, to be confirmed nearer the time.  The workshops and exhibition all take place in wheelchair accessible venues. Please contact Radar Loughborough University Arts for more access information at each venue.

Due to limited space at Nottingham Contemporary The Prediction Machine will unfortunately only be fully accessible from Monday 9th – Sunday 15th March when it will be installed on Level 1 close to the lift. Please contact the venue for more information

http://www.nottinghamcontemporary.org/event/prediction-machine

An artwork informed by climate science

a sketch of a cloud with temperature unknown across it

Modelling Climate Change

Climate Scientists create models to project how the climate might change in the future, based on what they see happening to the climate now and in the past.

The predictions used in this artwork – for a fictional 2044 – have been calculated using a very simple model. The model uses live temperature from a weather station at Loughborough University, it then adds the projected increase in annual average temperatures for Central England (estimated within a 30 year range from 2040 – 2069).

These calculations are for a future dominated by consumerism and globalisation – that the scientists call a high emissions scenario – where C02 continues to increase in the atmosphere due to our ongoing use of fossil fuels (oil, coal, gas etc…). In this case the temperature is projected to increase approximately 3.7 degrees centigrade over the period of 2040 – 2069. Future versions of the machine will use a more complicated climate model, in order to represent a more complex picture of how the climate might change in 30 – 50 years time.

Please note that The Prediction Machine has been informed by scientific climate and weather data but interprets this data through dialogues with communities and scientists in order to give us a sense of how today’s weather might feel in the future, it does not aim to create a scientific climate model.  The predictions have been written by people who live and work in Loughborough in response to climate data, through their own interpretations and taking part in workshops with the artist. The Prediction Machine therefore enables us to reflect on how we perceive climate change in our everyday lives – rather than a scientific experiment.

To explore the MET office graph showing a full set of projected temperatures for Central England with different emissions scenarios for 2040-2069 for yourself click here

What Do We Mean By Climate Change?

The Prediction Machine focuses on human made climate change.

Climate Change is most commonly talked about in relation to human made (anthropogenic) changes in the earth’s climate (Norgaard 2011; Washington 2013; Wrigley 1999; O’Hare et al. 2005).  There are differences between the terms ‘climate change’ and ‘global warming’. Climate change relates to a broad definition of the Earth’s climate, whereas ‘global warming’  focuses on the Earth’s ‘increase of temperature over time’ (Boykoff 2011). Global warming can be seen as the ‘fingerprint’for human made climate change (Wrigley et al. 1999).

The anthropologist Norgaard suggests that there are two basic facts that we need to be aware of in order to understand issues of anthropogenic (human induced) climate change:
‘if global warming occurs it will be the result primarily of an increase in the concentration of carbon dioxide in the earth’s atmosphere… the single most important source of carbon dioxide is combustion of fossil fuels’ (Norgaard 2011)

There are ongoing discussions about whether and how we can focus on putting less CO2 into the atmosphere (mitigation) or dealing with the consequences (adaptation) – or hopefully – both.

To see a visualisation of how the climate has changed in Central England over the last 100 years and since you were born click here

Weather and Climate

Climate is different from weather. Climate is the patterns and trends of weather in the Earth’s atmosphere that are measured over a particular region, or globally, over a long period of time (typically 30 years). Weather is what is happening in a particular place, at one moment and over a shorter period.

The Prediction Machine plays with our ideas of climate and weather, it uses climate data (a projection of long term temperature trends for a 30 year period) to give an impression of what the weather and our world might be like in the future, as a result of the climate changes projected by scientists.  This is a common if not over simplistic way to model how climate change might affect us in the future and has been developed in dialogue with several climate scientists who have advised the artist throughout the development of the project.

Exhibition of The Prediction Machine

The Prediction Machine

The Prediction Machine will be exhibited from Wednesday 1st – Saturday 25th October 2014 at the following venues:

Pilkington Library Cafe, University of Loughborough
Wednesday 1st October to Wednesday 15th October

Loughborough Library, Granby Street, Loughborough
Saturday 18th October to Saturday 25th October

The Prediction Machine’s Climate-Change-Harvest-Festival, University of Loughborough
Sunday 26th October
Come along for some seasonal food, a procession to the weather station led by the artist and an opportunity to write your own predictions, actions and wishes for the future as part of an alternative Harvest Festival.  Times and venue tbc.

More information coming soon… including artist talks and guides to the machine and accessibility information

Final public workshop

cold

The final workshop took place this week and it was sad to end the sessions, particularly as a core group has emerged with the wonderful team. I really want to thank all the people that came along to the workshops over the last six months and for their contributions to the machine, the predictions and the video messages.

This session focused on how we apply the predictions to the data, through finishing off the data maps. Ravi also filmed each member of the group to make the video messages that will appear on the screen in the machine. We also discussed what the final event will be at the end of the exhibition to mark the changes we have experienced over the last six months – more information about this event is here…

The data maps look amazing and create a really interesting interpretation of the process we have been through as a group, how we connect the climate data to our narrative predictions (that will be in the machine) and also gave us ideas for the final event.  These data maps will be on display at Loughborough Library during the exhibition of The Prediction Machine, Satuday 18th – Sunday 26th October.

mild

data maps made from felt representing arctic and cold temperatures

felt data map representing warm temperatures


Testing the machine

printer with test predictions printing and the The Prediction Machine logo

Last week we moved forward with testing and building the machine… The printer is working and is amazingly robust, it is a proper kiosk printer like the ones you get in parking ticket machines (put to a good use for once i’d like to think), it is a thermal printer so doesn’t need ink but i have not managed to get recycled card for it as yet – this is something i will be looking into for next year and when the machine goes on tour.

We tested printing out predictions based on the data ranges coming from the weather station – you can’ t really tell from the print out yet but the text at the top responded to the warm dry weather in Loughborough coming live from the weather station. We also tested the basic functions including the lights for the sign, the hand crank powering the screen and the voltage levels from the crank that tells the machine when to print (after 10 secs of full voltage). We tested the Timestreams coming from the system being developed at Horizon / Mixed Reality Lab at University of Nottingham that enables us to transform and mediate all the weather and climate data used by the machine. It all worked!

the oak machine in it's basic form (before any finishing is put on) and missing the sign at the top

Matt Little setting up the hand crank

lights for the sign controlled by temperature data

Building The Machine

final design sketch of the machine

We are nearly there with the first test of the machine – due to take place next week.

Ian Jones (Sherwood Wood) is the brilliant carpenter who is building the machine with me and Matt Little is the equally as brilliant engineer who is building the guts and functions of the machine.  So far we have a mock up of it’s basic functions in MDF and the metal frame is being made ready for next weeks test.  We have also been working on the finishing, panelling and metal decorative bits to finish it off. It needs to looks like it has travelled through time and space and all weather to get to the place it gets to (like the Tardis in Dr Who) but that it is highly technical, with an added hint of magic.

Next week we will hopefully be testing the machine’s functions from end to end…

1. Testing the sign controlled by temperature readings from the weather station

2. Testing the hand crank and video controlled by precipitation (rain)

3. Testing the printer with future weather scenarios for 2044 and a webcode that will enable people to type in the code here on the website and see explanations about how the predictions were made

Testing the sign
The sign at the top of the machine will light up, the lights increasing in intensity based on the live temperature from the weather station.  When an extreme weather scenario occurs (based on live temperature, precipitation and wind speed) occurs then the sign will pulsate.

The Prediction Machine test sign with LED lights behind it

Testing the hand crank
The hand crank enables people to power the machine with their own energy – when the crank reaches 12 watts the screen powers on and ghostly faces appear, voices crackle into life and a message is transmitted disrupted by the weather data.  Precipitation, temperature and wind speed data break up the video, the more extreme the weather the less able you are to hear and see the message.

the hand crank

basic mock up of the machine

 basic mock up of the machine


Visualising Data at August’s workshop

August’s workshop involved visualising the data we collected whilst doing the human sensor activities and creating felt data maps for each weather type that we can then add the predictions to.  At the end of the next session we will have a felt data map to represent each weather type being used to understand current weather and then we will be able to sort which prediction goes with which weather type.  These felt data maps will become artworks in themselves as well as a way to understand how we can allocate poetic and evocative narratives about the future to the data.

We also talked about how we can mark this process through the event planned to take place at the end of the exhibition in October.  We talked about folklore, seasonal festivals and harvest festival.  We also talked about how we can symbolise and ritualise complex and distant things like seasons, climate and weather that are hard to understand in our everyday lives – which then led to making the abstracted data felt maps.

Mild Weather Data Map
1 to 15 degrees C

data map for mild weather types

planning the data map for mild weather types

Heatwave Weather Data Map
29 to 100 degrees C

data map for hot weather types

Arctic, Freezing and Cold Weather Data Maps
-100 to -0 degrees C

datamaps for arctic, freezing and cold weather types

Next session we will be adding warm and hot data maps and adding the predictions to the weather types

Public Workshop – Monday 11th August

Charlton Heston looking on as Sol commits Euthanasia and sees how the Earth once was before the climate changed and it became over populated

The next workshop will continue to look at the weather data being collected from the weather station at the University of Loughborough and how we can turn this data into descriptions of the weather and predictions for what is happening in the near future and in a future where they might be a 2 degrees or even 4 degrees temperature rise.

We will look at what has been suggested in the IPCC report on climate change in terms of the impact of climate change and our lives, environment and the weather.  The workshop will involve writing and/or video and audio recording.

Suggested viewing and reading:
Descriptions of snow – http://en.wikiquote.org/wiki/Snow
Poetry about weather and futuristic climates:
http://www.poetry-archive.com/e/rhapsody_on_a_windy_night.html
http://theotherpages.org/poems/eliot01.html
A man who captured his response to the weather reports – http://cabinetmagazine.org/issues/3/henrydarger.php
Feature films and TV about climate change, extreme weather, futuristic dystopia and utopia:
Waterworld
The Hunger Games
Last Night
The Day After Tomorrow
Solyent Green
Silent Running
The 100


Workshop Event – Monday 14th July

"It's snowing still", said Eeyore gloomily, "And freezing." "However, " he said, brightening up a little, "we haven't had an earthquake lately" - A.A. Milne

July’s session will take place on Monday 14th July. The session will focus on making the predictions for the machine in response to the data you collected in the forest and the scientific data being collected from the weather station. The session will be an informal look at how we can bring together science, predictions, fortune telling, poetry and folklore to make predictions about our future. The session will look creatively and collaboratively at how we can make these predictions and is not reliant on writing.

Rachel is preparing some resources to share with the group including poetry, films and images based on other people’s visions of the future, and how changes in weather and the seasons have been reflected upon by writers throughout history. If you have any examples that you would like to bring along from your favourite futuristic utopian or apocalyptic film, poetry about seasons or environmental change or everyday sayings, then we would love to have your input and hope that you can join us for the session.

Please do book your place again via eventbrite and please don’t hesitate to contact us if you have any questions about the next session –
https://www.eventbrite.co.uk/e/the-prediction-machine-3rd-workshop-tickets-11648754739

The workshop will be taking place in the same venue that the first session was held in back in May – LUA Project Space, Edward Barnsley Building, which is next to the college and also home to Cope Auditorium & the School of the Arts. Attached is a map and directions, or you can find us on the university online map – http://www.lboro.ac.uk/about/map/


Visions of the future…

Spring in Ploughman's Forest, Nottinghamshire

I am in the process of putting together images, poetry, prose and films that represent how we perceive the seasons, the weather and climate and imagine how these will change in the future.

I hope that this can provide a starting point for writing the predictions for the machine.

“The wind had dropped, and the snow, tired of rushing around in circles trying to catch itself up, now fluttered gently down until it found a place on which to rest, and sometimes the place was Pooh’s nose and sometimes it wasn’t and in a little while Piglet was wearing a white muffler round his neck and feeling more snowy behind the ears than he had ever felt before.” A.A. Milne, The House at Pooh Corner

“The seasons’ difference, as the icy fang 
And churlish chiding of the winter’s wind,
Which, when it bites and blows upon my body,
 Even till I shrink with cold, I smile.” Shakespeare, As You Like It
 

“In the spring time, the only pretty ring time,
When birds do sing, hey ding a ding, ding;
Sweet lovers love the spring.” Shakespeare, As You Like It


If you would like to contribute some suggestions please tweet them to @hello_tree

Workshops

how do we respond to climate change? - go north, guilt, may have to adapt buildings in new weather conditions, connecting more with nature, becoming more observational, changes in behaviour mitigation and adaptation, relating to plants and growing patterns for the common connection, increasing unpredictability planning anything may become difficult, individual local/collective/national/political response

Two workshops have now taken place in Loughborough that is bringing together people from Loughborough to explore how we mark, record, understand and respond to climate change in our everyday lives.

The first session was an introduction to the project, I took along the life-sized cardboard version of the machine to show people what the artwork will look like when it is exhibited at Pilkington Library (on the University campus) and Loughborough Central Library. I also made fortune cookies again, with a plate for a different future scenario (increased consumerist society, a collective environmentally conscious society or continuing as we are). Each cookie (these were made with a Brazilian Empadinha recipe) had a ‘climate fortune’ inside that related to the future scenario.

After presenting and talking about the project and also introducing the research that my colleagues at the University of Nottingham are doing with me (into the impact of this work on our responses to and perceptions of climate change) I introduced the first activity which asked the group to discuss three questions and note down their responses onto paper discs (see some of the responses in the image/alt text above). The questions were:

1. How do we connect climate change and weather
2. How can we connect data and narrative
3. How do we mark and respond to these changes

The aim of this session was to start a very broad discussion about how we think and feel about the issues at the core of The Prediction Machine project.

the group standing in Holywell Park, a predominantly Ash Forest on Loughborough University's campus

The second session involved the group (with many new members) joining myself and Jon Millet, an ecologist based at Loughborough University, on a walk in the forest. Jon presented his research in the forest on Ash dieback, explaining how the forest will change in the future and how it has changed and evolved since  it was cut down in the second world war.  We then became ‘human sensors’ in the forest, enacting with our bodies how the weather stations that Jon is using to sense changes in the forest works (and how the weather station works that will control The Prediction Machine).  To do this we wrote down on a scale between 1-10 what we thought the temperature, humidity, sound, light and air quality was. It was a lovely walk on a sunny day in this fascinating ancient forest that has been destroyed and regrown, half through planting and half naturally. We could feel a difference in light and environment between these two halves and very much felt the ongoing impact of the winter storms, where the soil (particularly on the replanted side of the forest that has less light reaching the floor below the tree canopy) is wet with mud and without heavy boots was nearly impassable at times. Jon told us that the soil here hasn’t recovered from the huge amounts of rain so any additional rain has just saturated the soil.

The next session will start to look at how we interpret that moment in the forest (and for people who missed the session their will be an opportunity to do their own human sensing), looking at other artists, writers, film makers interpretations of the environment and how it will change in the future we will begin to compose our predictions for what standing in the forest will feel like in 2044…

Workshops, hand cranks and lost in data…

Matt testing the hand crank to power the telly

Matt testing the hand crank to power the telly

I am preparing for the first workshop, which is taking place in Loughborough this evening and looking forward to meeting the people who have signed up to participate. I have fortune cookies baked and am bringing the cardboard machine again to introduce the project so we begin work on tracking climate moments.

Meanwhile…

I presented the project (and fortune cookies) at the Friction Conference on Technology and Resistance hosted by the dept for Critical Theory at the University of Nottingham. The project seemed to go down very well and involved lots of discussion about how we deal with climate change as citizens and also the nature of dialogic politics – can dialogue act as a political process?

On a more practical level I am also working with Matt Little on the ‘insides’ of the machine. He has built the hand crank which we tested a couple of weeks ago. It is quite addictive, you need to turn the handle to generate enough electricity to power a CRT screen (an old telly) and speakers. This will show a visualisation of the live weather data and projected climate data, to explain how we calculate the predictions. The audio will be messages for the future about our climate that I will be working with the people who participate in the workshop on to develop.

The hand crank is quite hard but if I can do it then we figure it should be possible for a wide range of people to power the screen, and it is possible for two people to work together if not.  It is easy to start the power and switch on the speakers but when the TV screen switches on there is alot of resistance, this is the hard bit, it sort of kicks back and then it is quite hard to keep it going for the 10 seconds that you will need to view the screen to see the visualisation.

**spolier** I am hoping the machine will give the impression that you are powering the whole thing with the hand crank when in fact we are timing it so that it looks like this – in fact the hand crank will only be able to power the screen and speakers – the computer inside runs everything else will be attached to the mains (for now) – eventually I hope to power this with solar power.

The next step in the machine building is deciding which printer to get, Matt is working on the levers and dials and meanwhile Mouse and Jesse are working away at getting the weather station data into our data platform so we can send it to the machine along with our future scenarios and the data (which i’m still trying to find) for 2034. More on this to come.

Come and take part in the workshops

hands holding a broken fortune cookie and the fortune 'the bananas will run out'

Image copyright of Julian Hughes

The Prediction Machine public workshops are starting next week and we would be very excited if you wanted to join us and help develop the project – as well as explore with us the impact of climate change on the local area – book online at:
I will be conducting a series of workshops as part of developing the final artwork ‘The Prediction Machine’ which will be exhibited at Pilkington Library at Loughborough University and also the central library in Loughborough Town Centre in October (exact dates to be confirmed).
A brief preview of the what will happen during the workshop sessions:
  • introducing the project in more detail, my research and work with climate scientists and looking at the data
  • an opportunity to visit the forest that is on the University Campus
  • writing predictions
  • planning an event that responds to the climate changes that we track
  • recording messages for the future about these changes
The workshops are for 2 hours, on the first Monday of every month from Monday 12th May, you will not need to attend all of them although that would be preferable.

Thunderbirds, science art and humanity

Thunderbird toy box design by my Grandfather Jack Rosenthal

An image of a Thunderbird 5 poster, designed and made by my Grandfather’s company Jack Rosenthal Toys Ltd.

I have just been sent this post by my colleague Deborah Tatar who I am collaborating with on research into ‘art and power’: http://interactions.acm.org/blog/view/its-spring-and-a-girls-thoughts-turn-to-design-and-meaning

It is a very timely post in many ways as I am going to London this weekend to attend my own family’s version of a Seder. Deborah’s description very much brought back memories of when my Grandfather was alive and the kind of stories he told. As an ex communist and active socialist his stories were often very much focused on fighting for a sense of humanity, for a greater equality across our British class system and against the forces of capitalism. Alongside this he was in fact a business man and an innovator having invented space toys for a mass market in the 1960s. He designed and made the first Thunderbird Toys. He set up the company J R Toys Ltd which later became Century 21 Toys, working with Gerry Anderson on his merchandising. I think about him and his innovative ideas, the contradictions of a business man who was a communist, an innovator at the forefront of  TV merchandising and his dreams of rockets – as I embark on a new artwork, a new concept, collaborating with engineers, scientists, computer scientists – and sometimes games designers (through my work with Active Ingredient and Mudlark).

I am having some incredibly interesting discussions about art and science within and outside of the University, which also link to the research about art and power, particularly in the context of academia and computer science. Much of this is about the role of art and indeed ‘humanity’ (or emotion) within science. It is also reflected in the development of a new version of the ‘performing data’ system (being developed by the Mixed Reality Lab and Horizon at the University of Nottingham) to capture, mediate and interpret data. This discussion returns to the questions I raised in my thesis about the integrity of scientific data and how we can mediate data to create humanised experiences and narratives around it – that remain grounded in science.

The key question that keeps returning is ‘whose responsibility is it to oversee the integrity of science, data and art?’

The players are me (as an artist and researcher), a team of computer scientists, an engineer, two senior climate scientists and the group of people local who sign up to track climate change experiences within their everyday lives.

I hope that we can capture these arguments and dialogues through the research, but also through the experience of the artwork – and I will be very interested to see how they relate to wider discussions and research about art and power.

The IPCC Report on Climate Change

Spring in Ploughman's Forest, Nottinghamshire

Today the IPCC (Intergovermental Panel on Climate Change) released the second in a series of updated reports about climate change.  This reports on research that combines the work of thousands of scientists and experts.

This report shows that there is now overwhelming scientific evidence that the climate change we are experiencing is human induced, the world is not prepared for what is coming and suggests how we can become prepared and reduce the risks, a summary of the report can by found here.

How do we absorb this information, understand it or respond?

I am continuing my work with climate scientists and the public to find through my artistic practice ways to explore these questions.

Nowcasting Launch

visitors to the Nowcasting launch with Rachel and the model machine

On Sunday 23rd March Radar, Loughborough University Arts launched their programme of artworks – Nowcasting – that will link up to the Loughborough University weather station.

As part of this event I presented a cardboard model of The Prediction Machine, based on my designs, shown behind me in the picture above. I talked about the machine and began a dialogue about how we track, record and respond to the changes in climate.

I also presented my drawings and ideas and the fortune cookies as an informal discussion about the project with the people that came. People could sign up to participate in the workshops and pick up more information about the project.

hands holding a broken fortune cookie and the fortune 'the bananas will run out'

Fortune cookies were presented on three separate plates that signified a different future scenario based on climate change research. People were invited to choose a cookie from any of the plates by choosing which scenario was most likely.  The scenarios were taken from a document shared by Dr Candice Howarth (Climate Scientist):

Plate 1 – A future dominated by consumerism and globalisation (A ‘me’ society)
All bets are off… very high world temperatures, C02, holes in the ozone and air pollution, the Artic will melt, higher sea levels, more pests and disease, problems with growing crops and high demand for water, major loss of biodiversity, extreme storms, tornados and droughts. The UK will lose much of its landmass to floods and the sea.

Plate 2 – A future dominated by the common good, local, environmental concerns and local, national and regional autonomy ( A ‘collective’ society)
A small rise in temperatures and C02, continued unstable weather, rise in biodiversity, organic local farming, not much changes.

Plate 5 – A balance between consumerism and collectivity, where nations work together to support local and regional autonomy
Increasing world temperatures, pollution and C02 in the atmosphere that is managed by local and global solutions. An increased loss in biodiversity, the Artic will slowly melt, the sea levels will rise, more floods, more pests and disease, problems with growing crops and high demand for water, loss of biodiversity, unpredictable weather, extreme storms, tornados, heat waves and droughts.

children choosing fortune cookies from the plates

All photos on this page are copyright of Julian Hughes

The Story of the Machine

rainbow and clouds over the hills

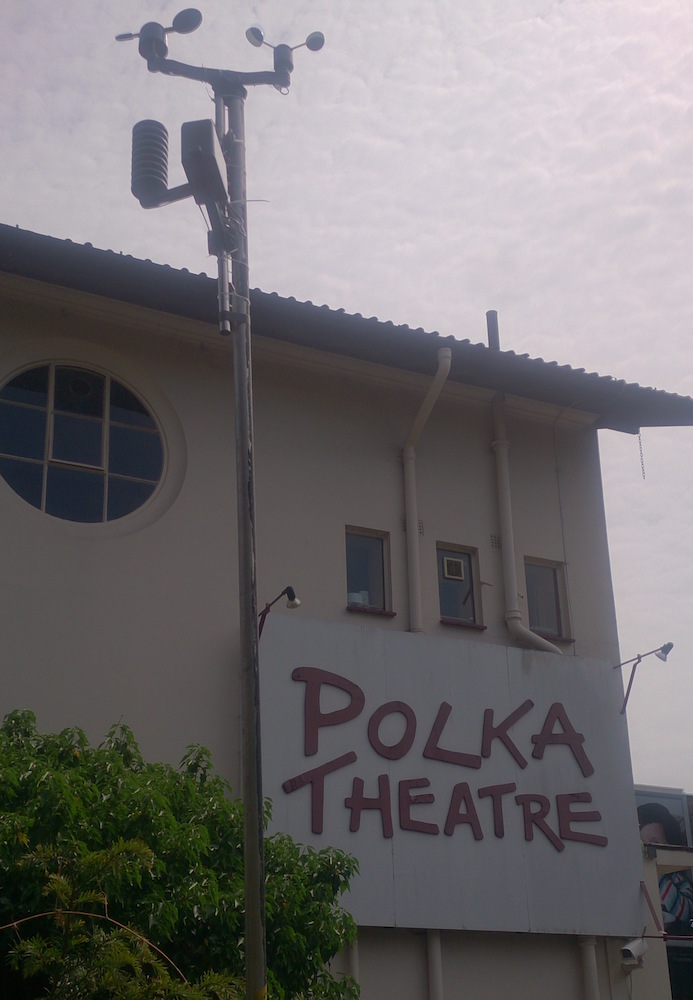
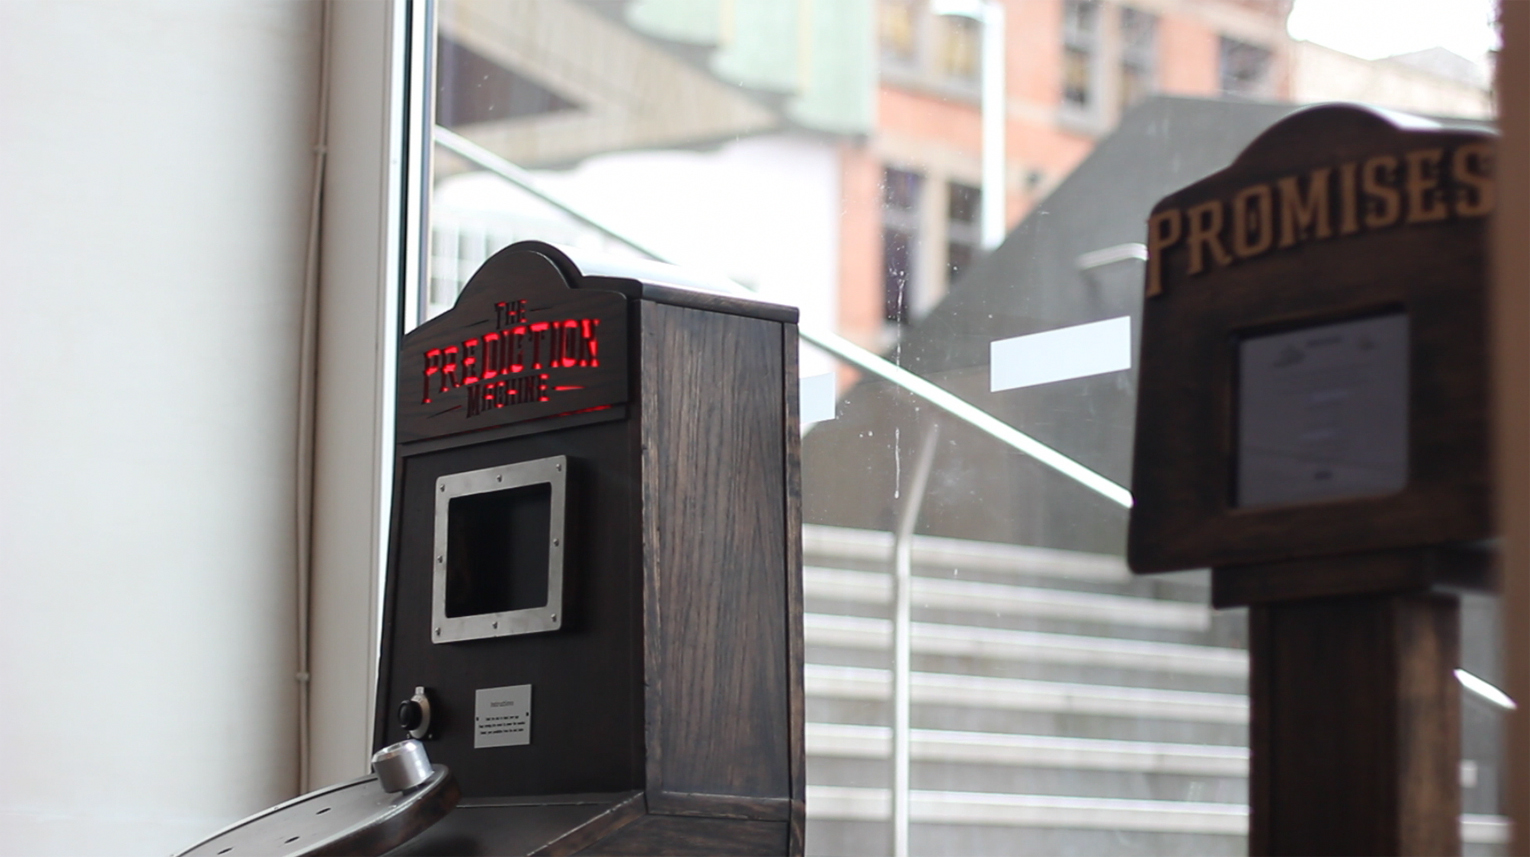
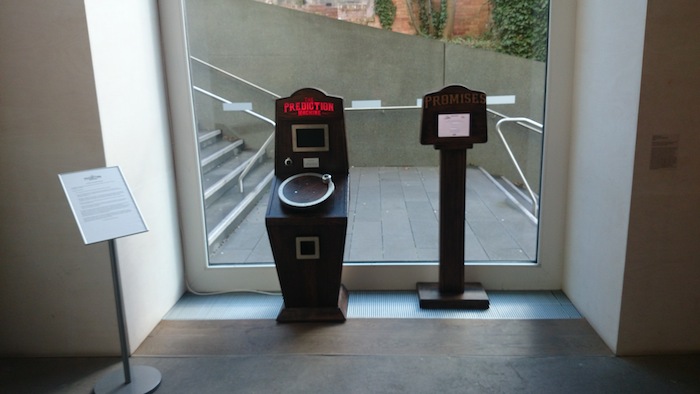
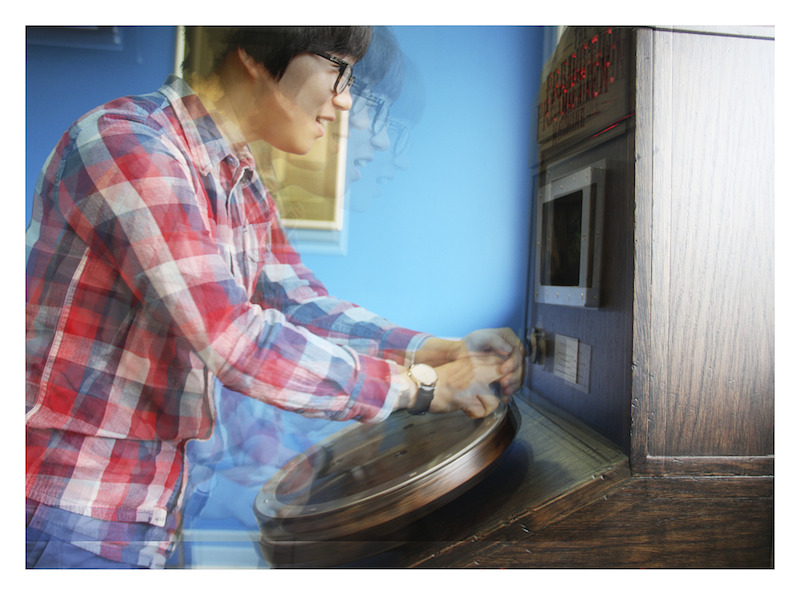
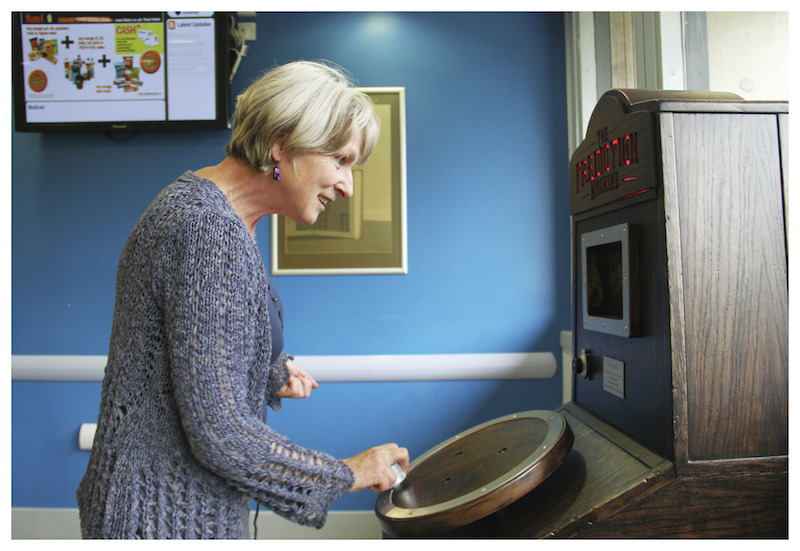
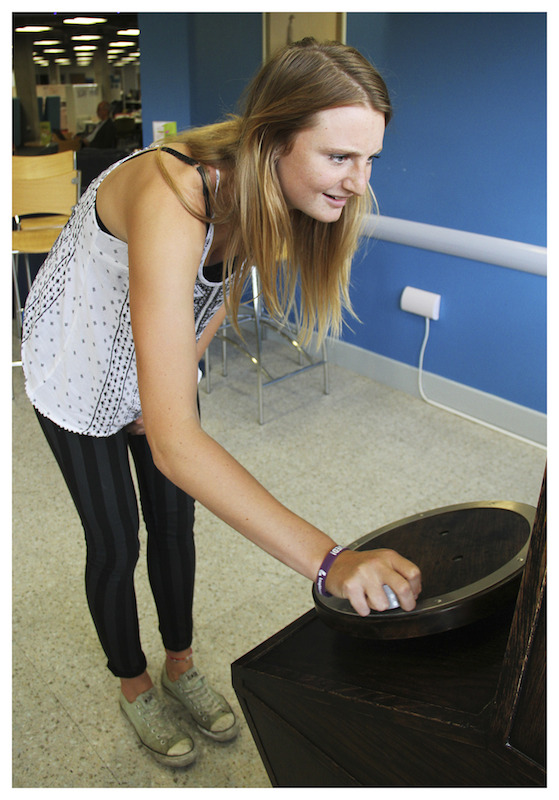
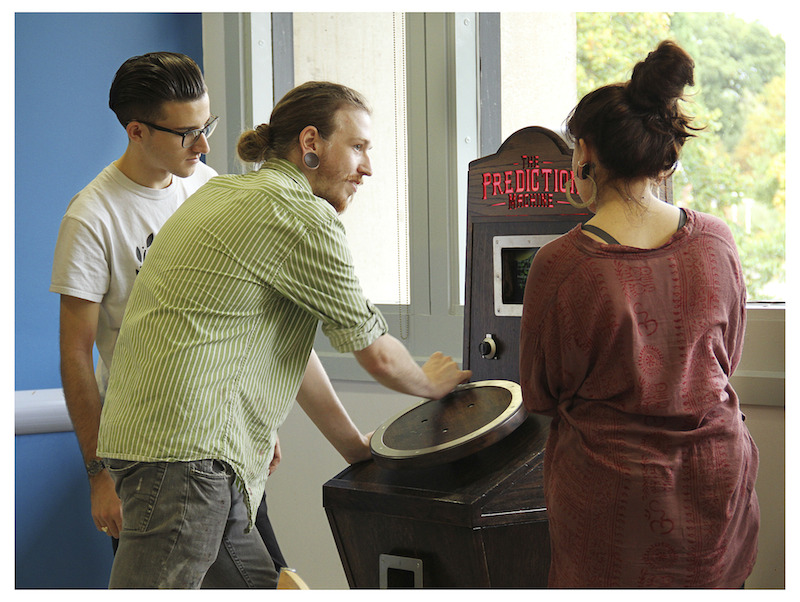
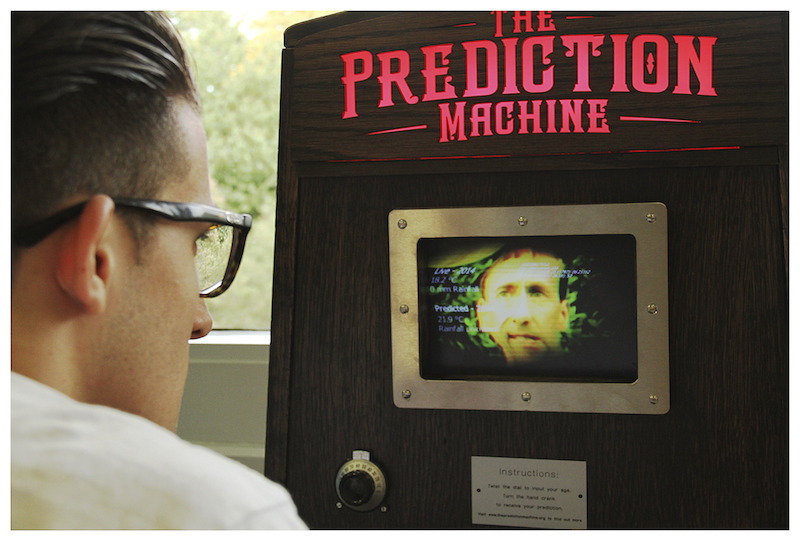
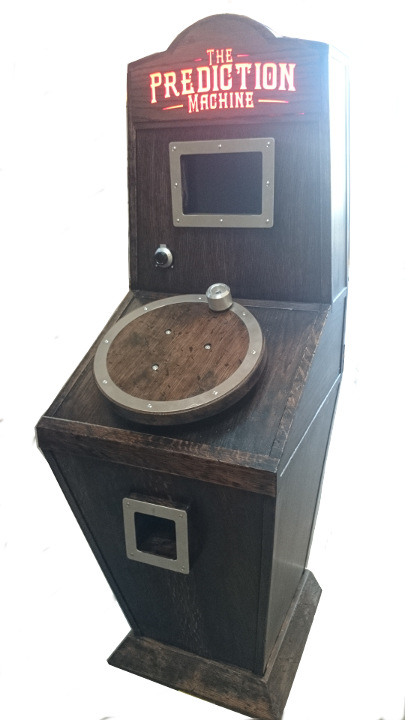
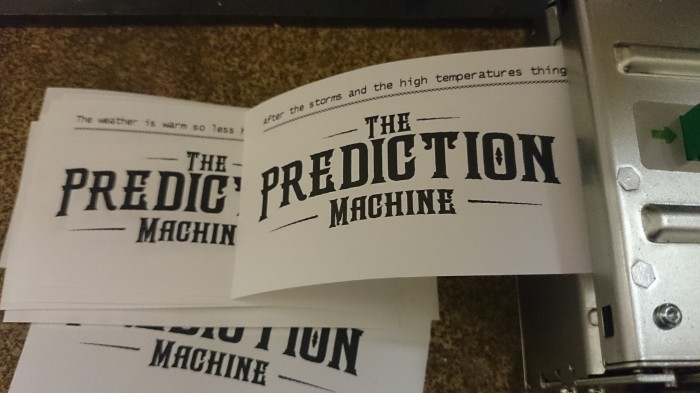
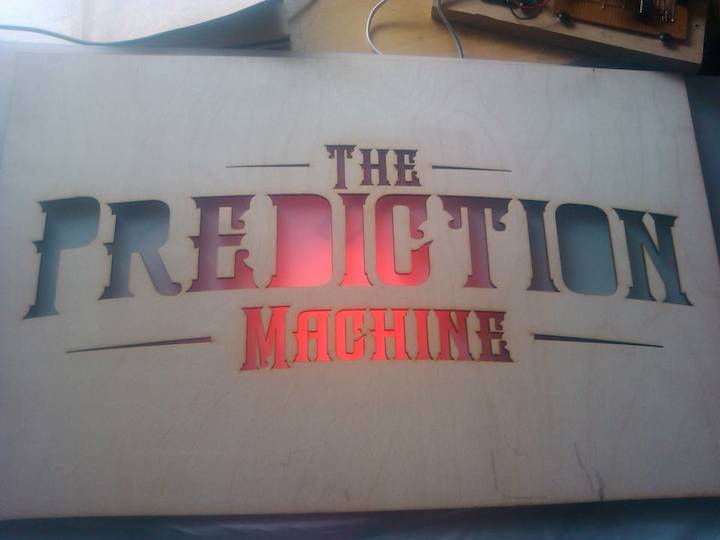
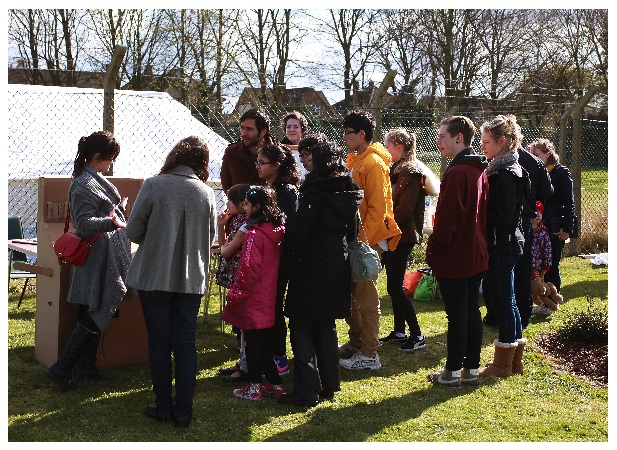
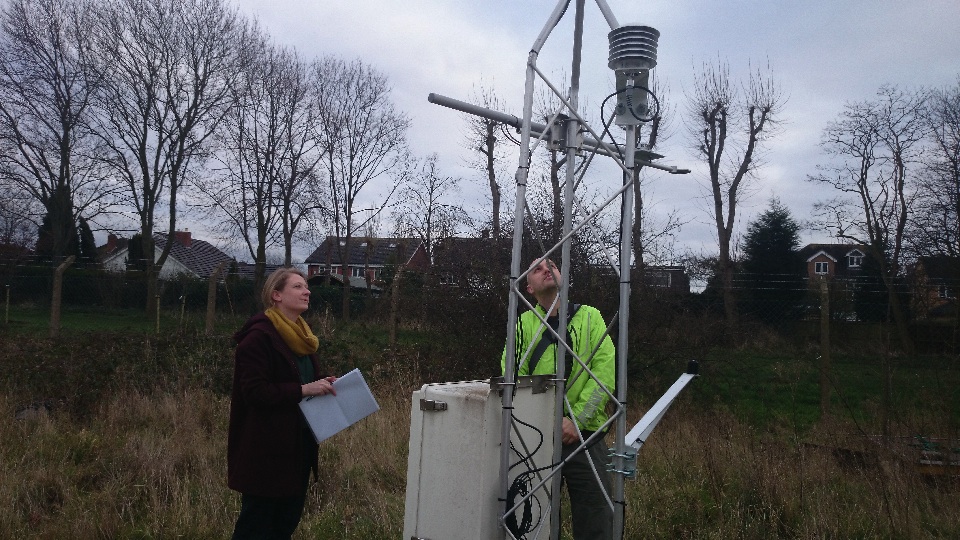
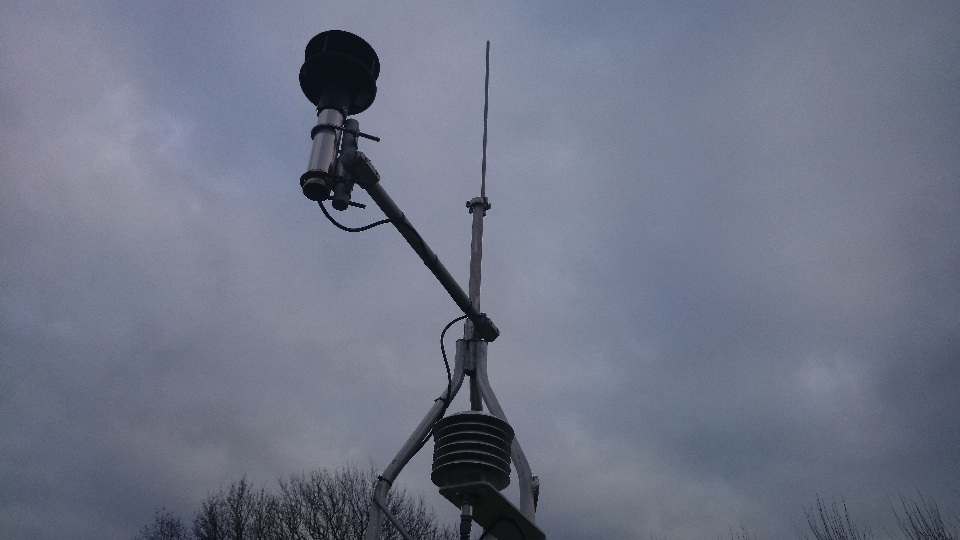
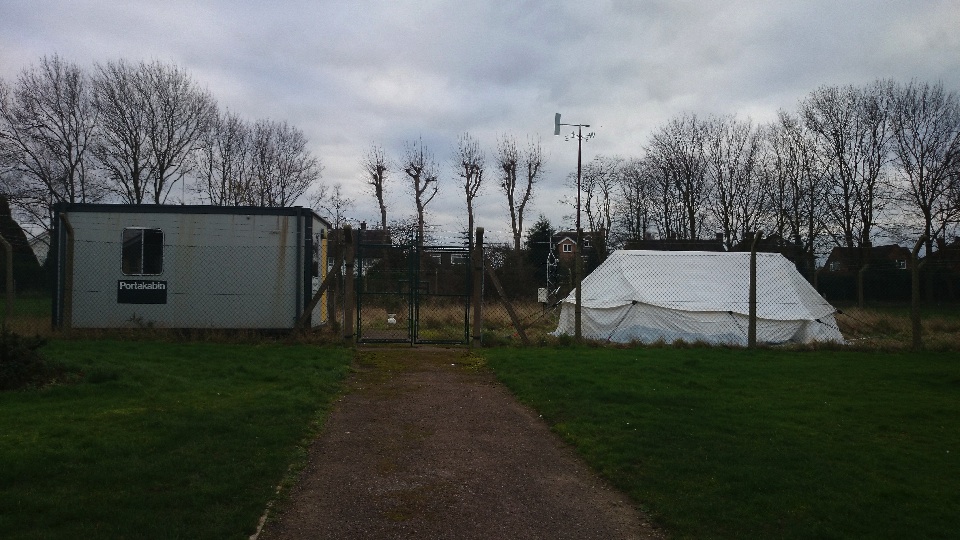
Roll Up Roll Up… to see plans for The Prediction Machine, a new invention to track moments of climate change that will be revealed this Autumn using weather data collected from a weather station in Loughborough, in the middle of this island…

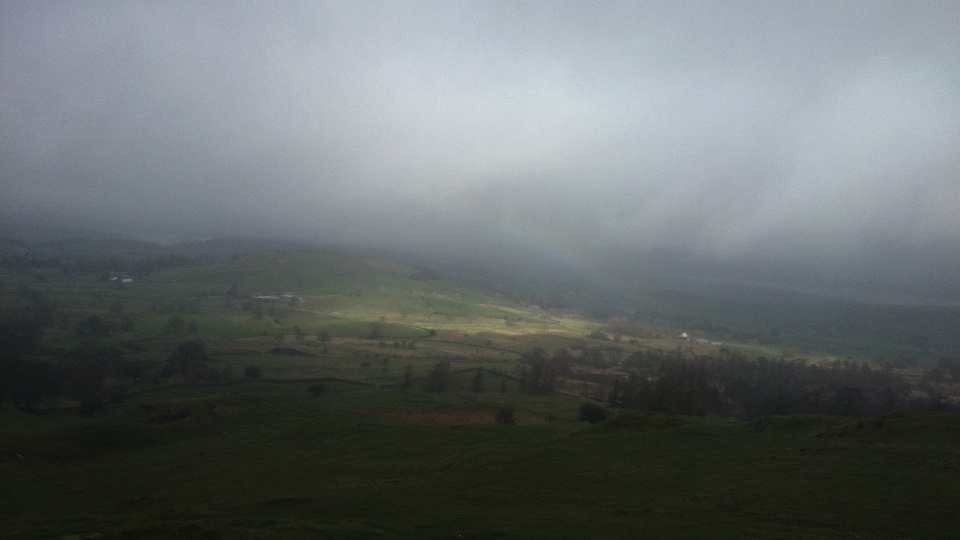
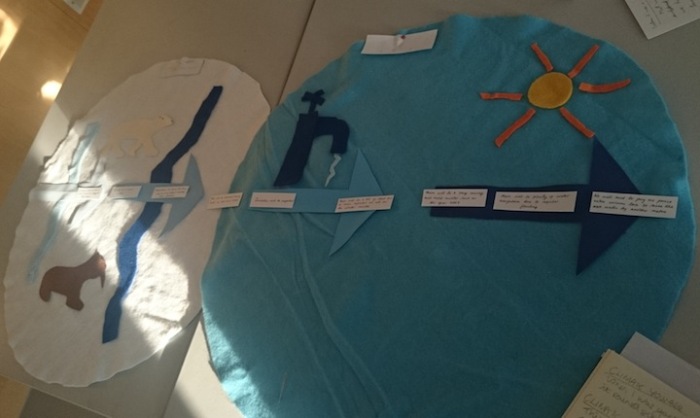
20 years into the future they say that the climate will change even more. As we have seen this winter storm after storm has come in from the Atlantic. The seas temperature are rising, the Artic is melting and the jet stream that carries our weather across the northern hemisphere is changing the way it flows. In 20 years our climate may change beyond recognition.

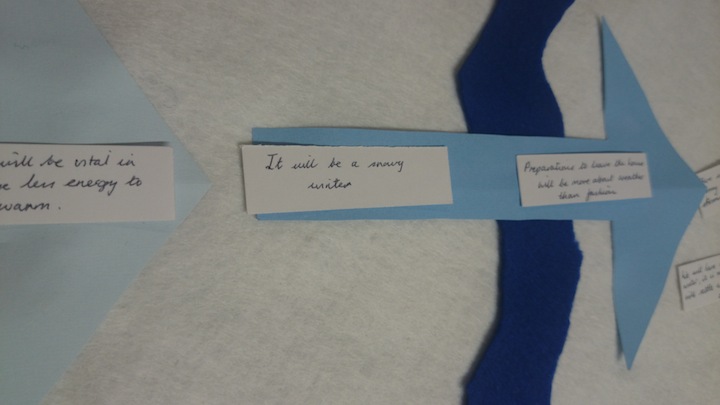
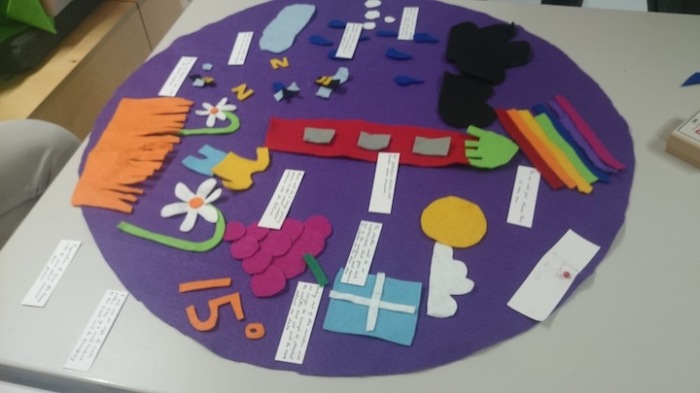
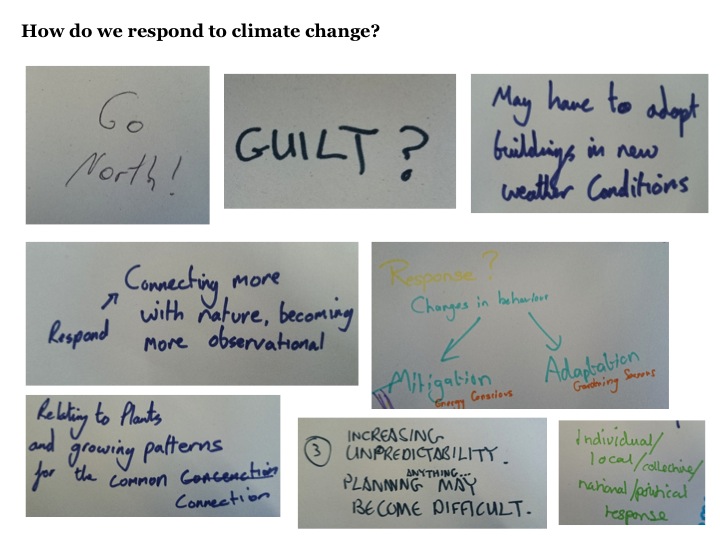
When these changes come we will no longer able to recognize the seasons, our folklore and sayings about the weather may no longer make sense and we will need to find new ways to prepare for the oncoming storms.

20 years into the future these violent storms could be followed by scorching heat.  After days of scorching heat a new storm could hit, flooding away another stretch of trees on the hill, rain falling in larger and larger drops, enough to take you out. We will need to find ways to protect the crops below the hill, our roads will turn into a raging river and we will easily be cut off from the rest of the world…

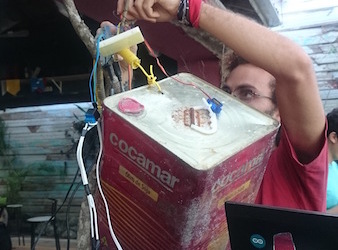
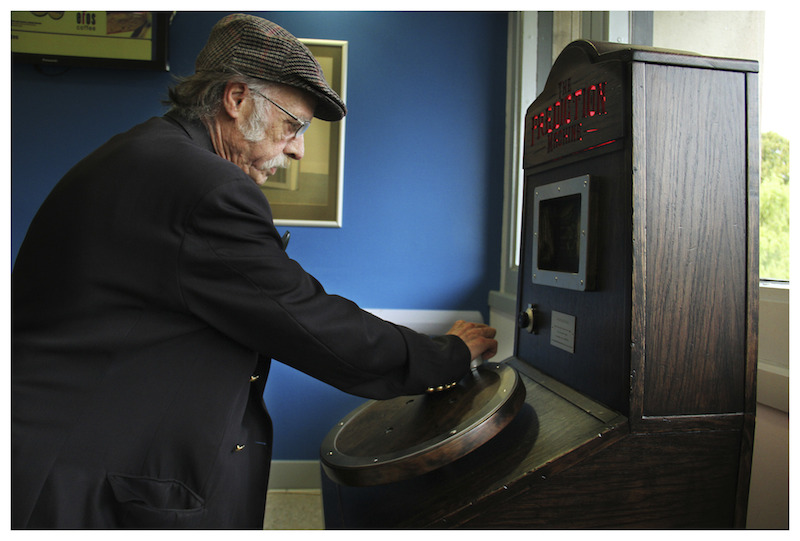
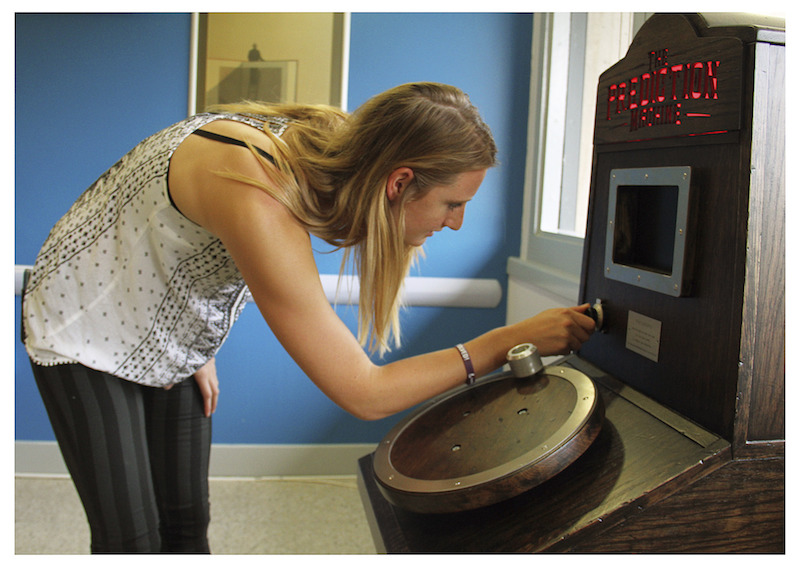
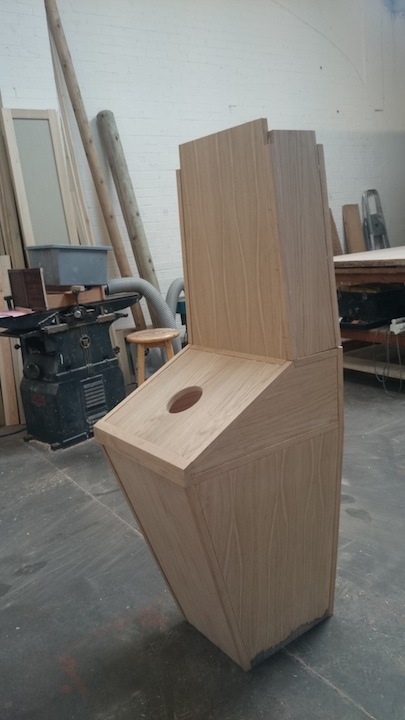
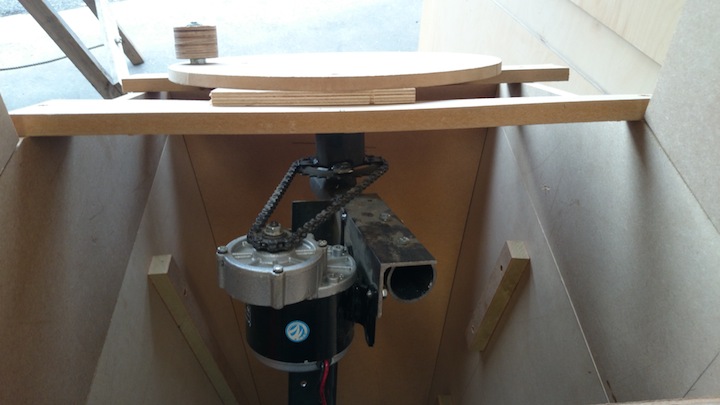
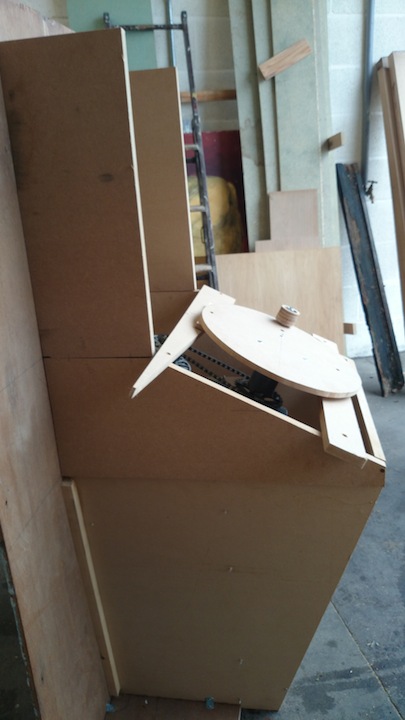
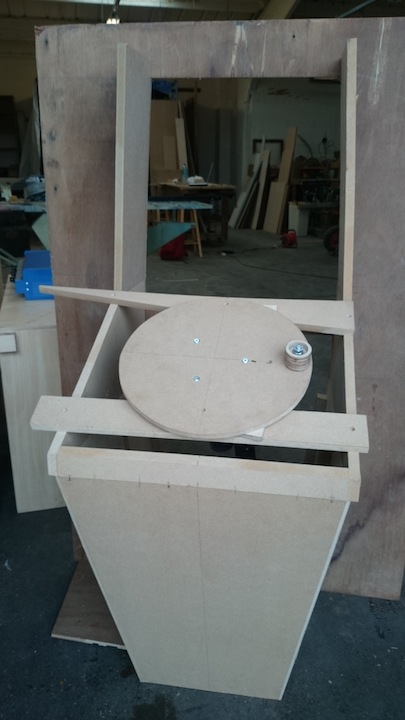
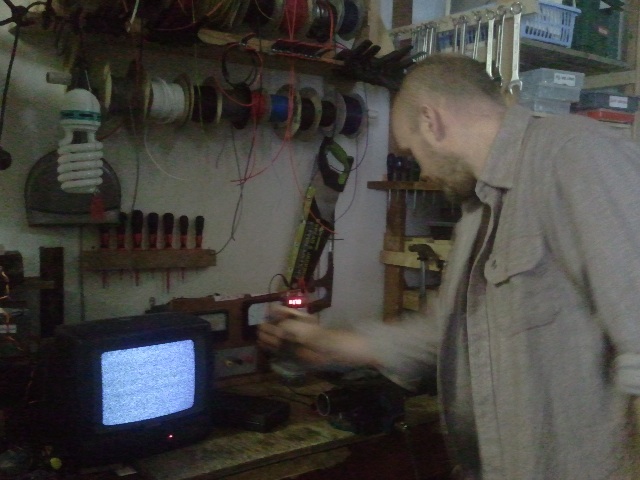
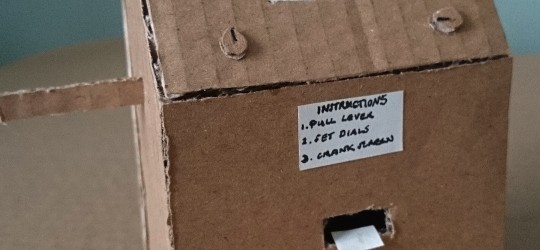
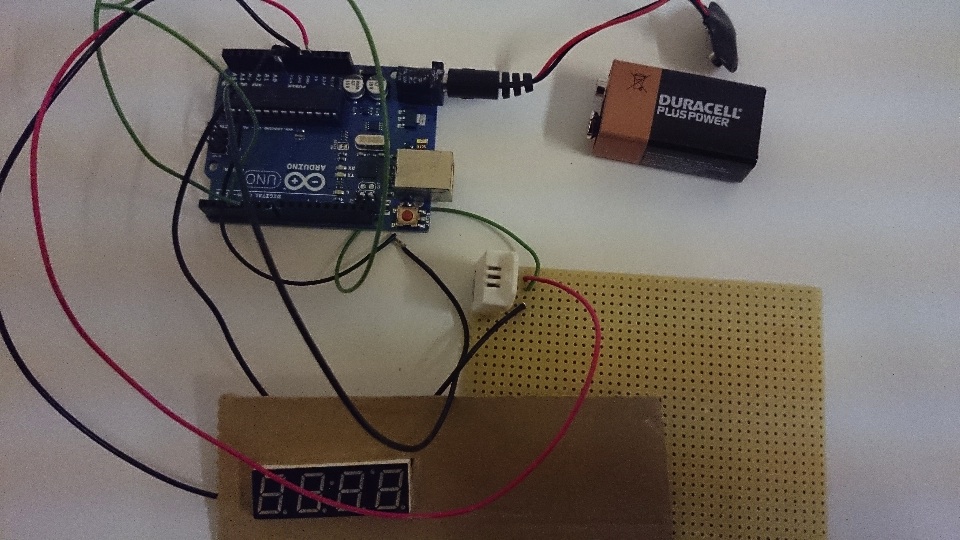
I would like to present to you my plans to build a machine, that will help us predict these extremes of weather that are coming our way, to help us to find out how to grow the right food in the right place, to protect our crops, our animals and our houses.

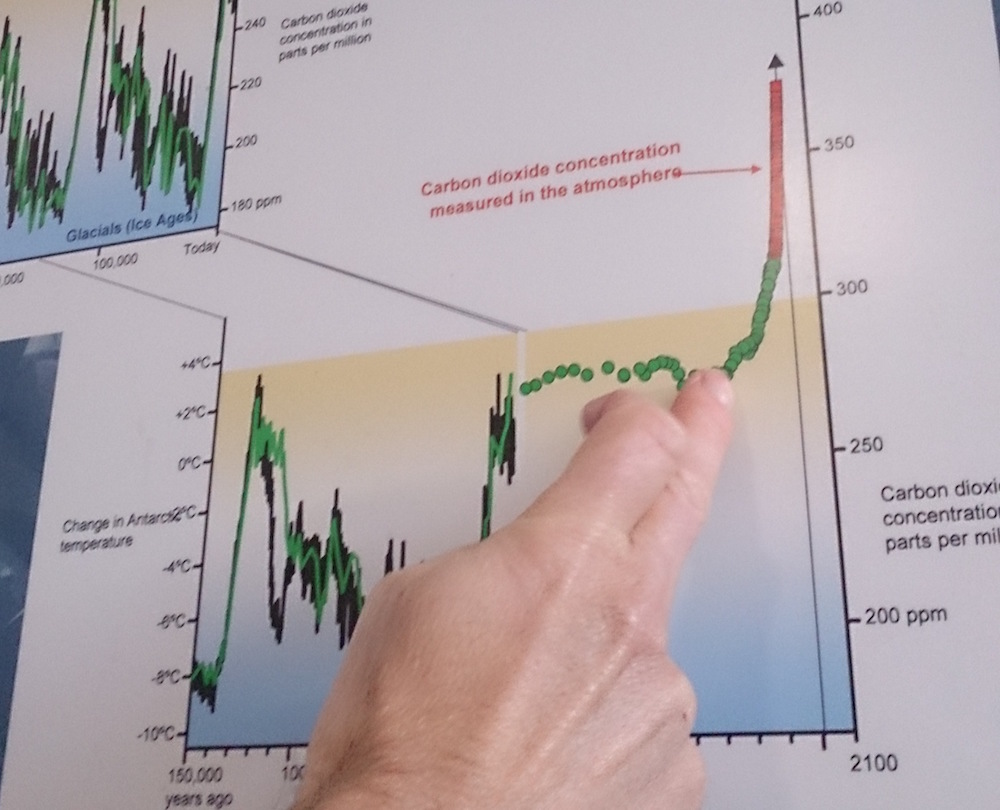
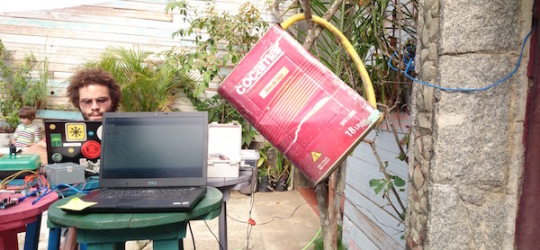
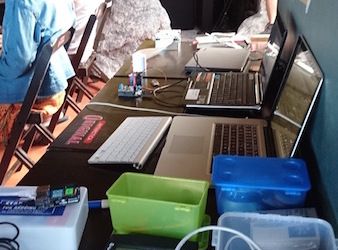
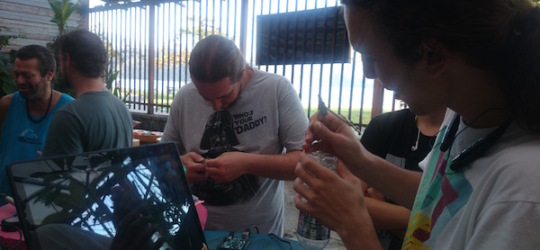
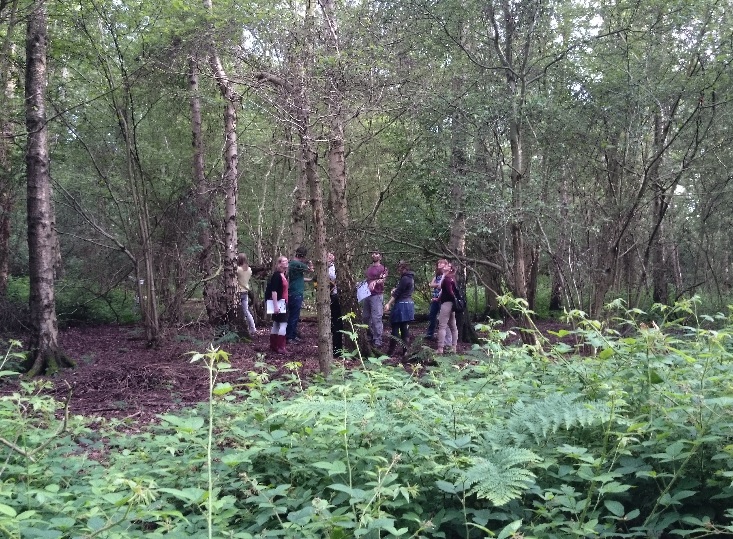
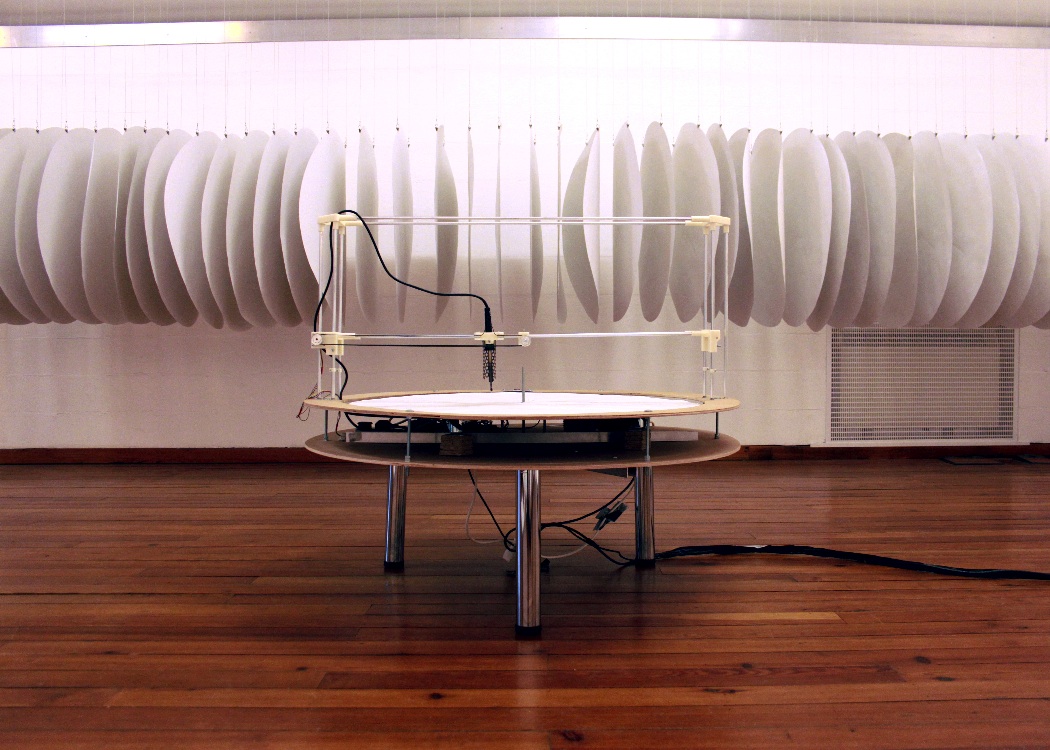
I will be combining knowledge of the climate gleaned from the scientists and local people to build a… prediction machine.

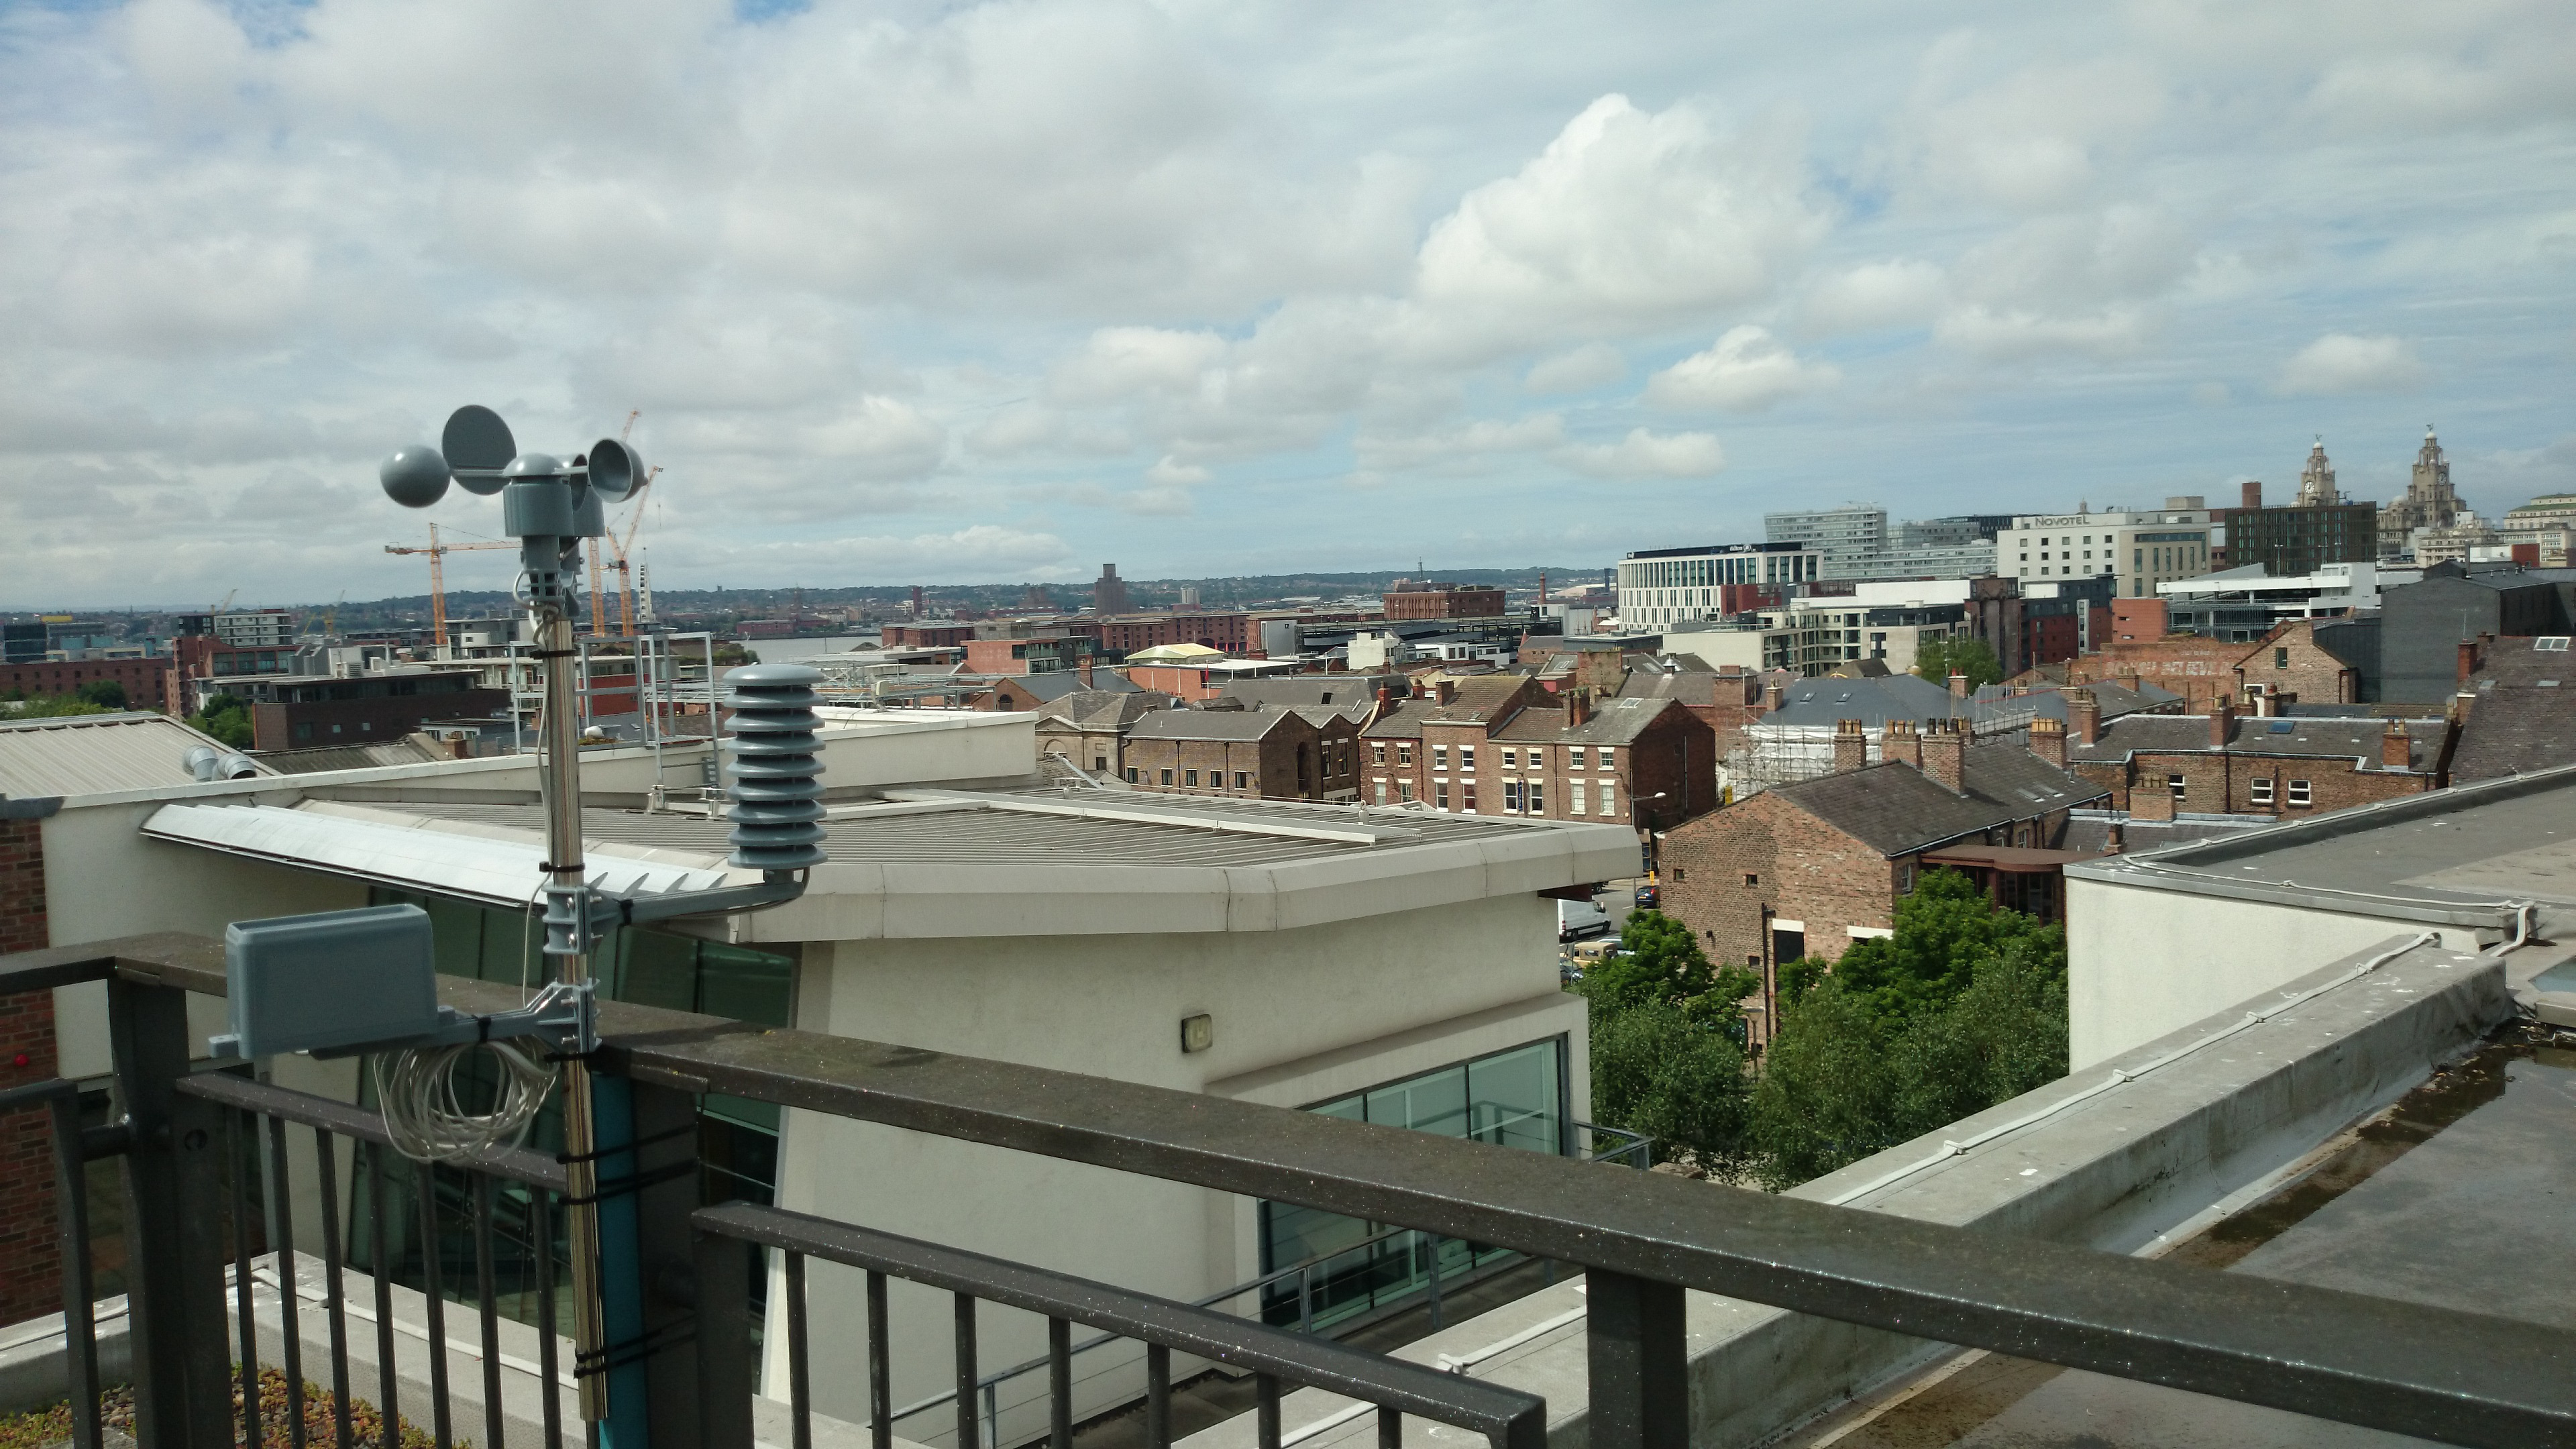
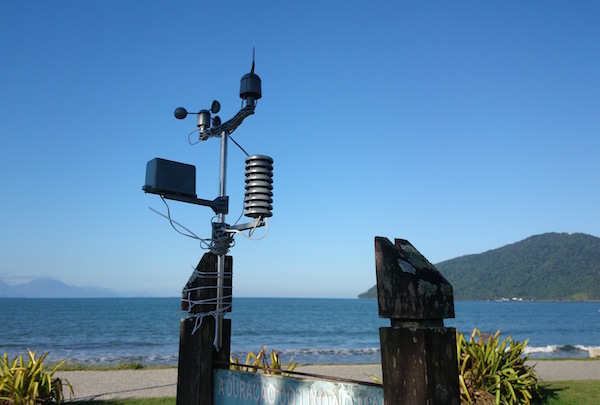
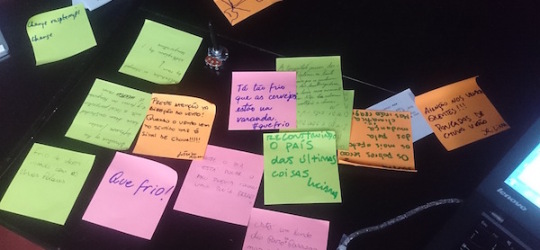
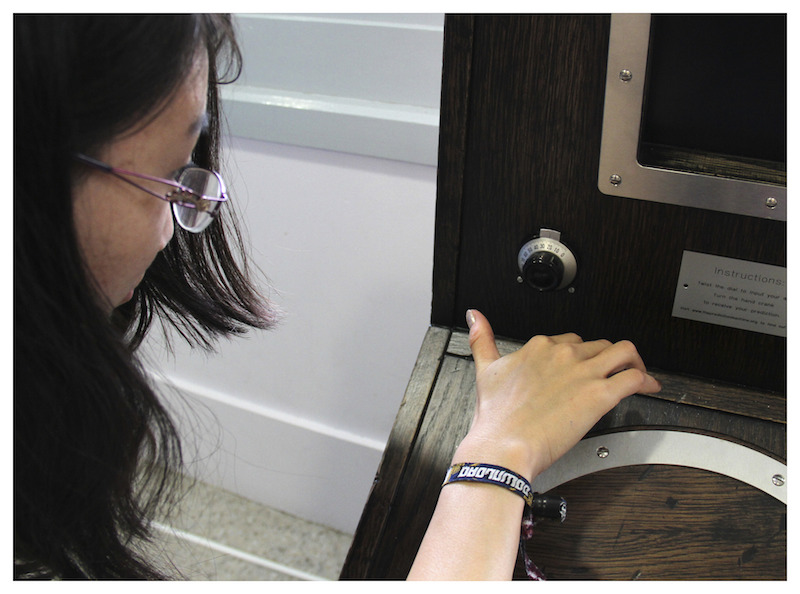
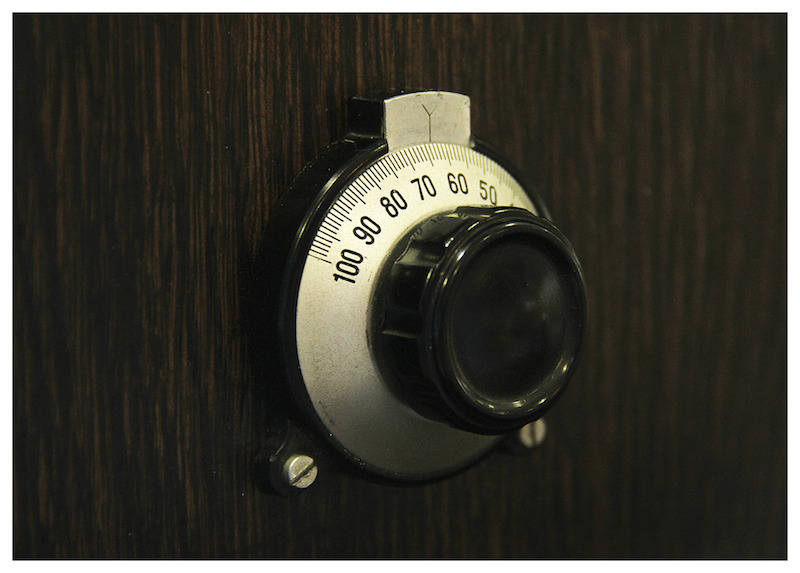
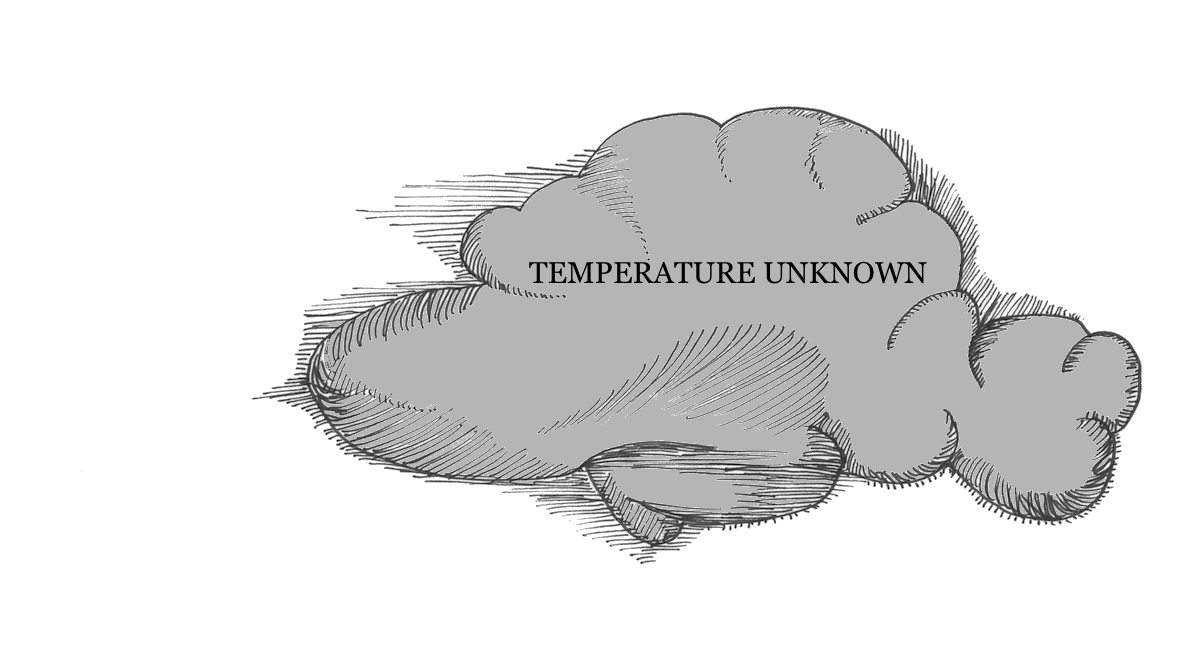
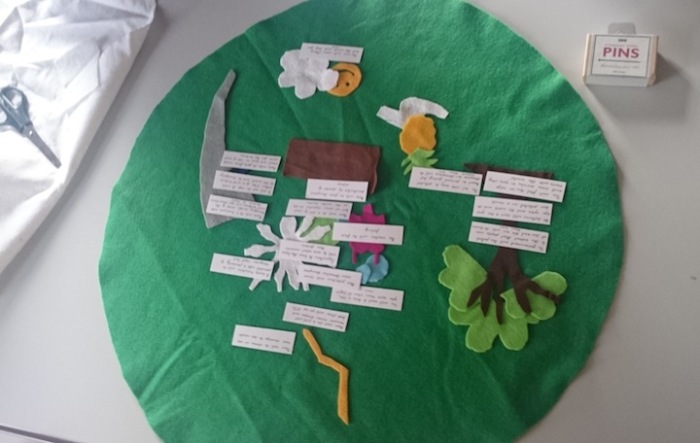
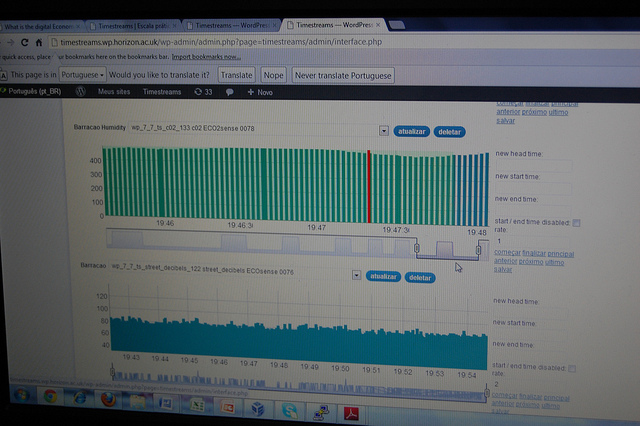
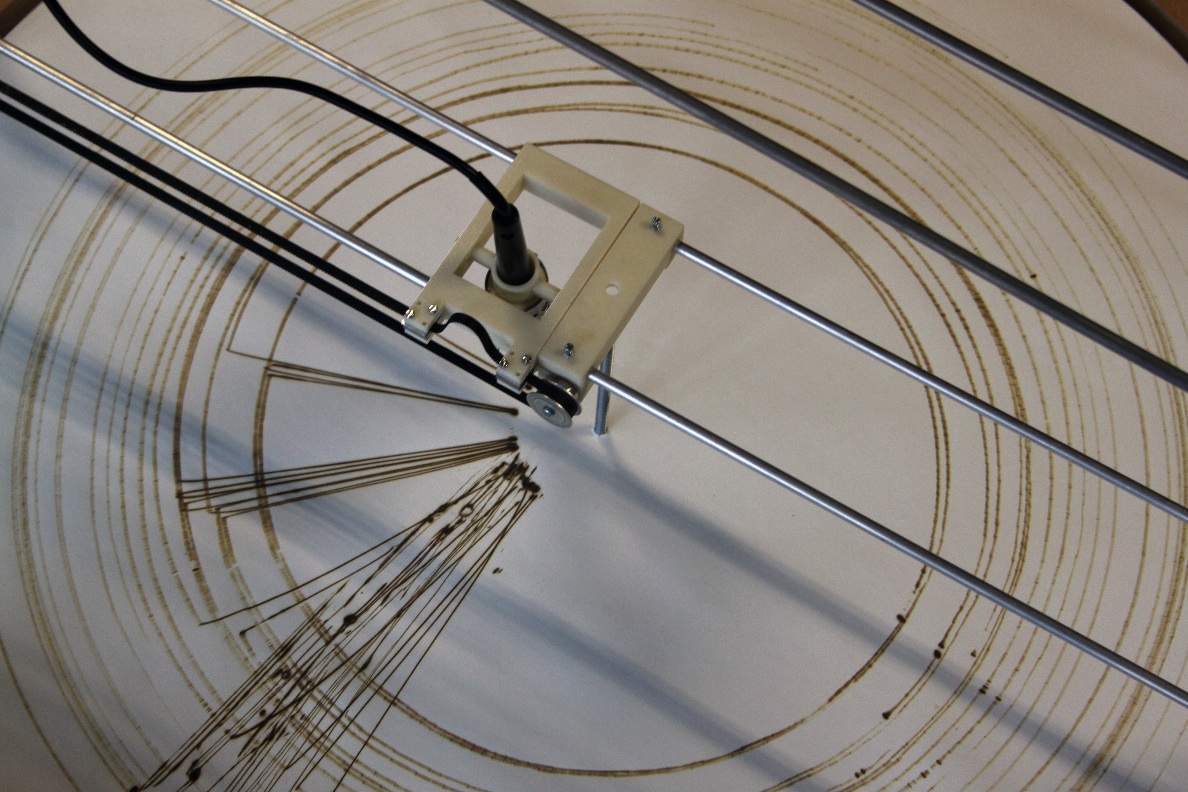
The machine reads the temperature, humidity and wind speed for the day, and matches these with projections for 20 years into the future, I will be collecting local observed phenomena, folk lore and sayings about the weather to help build the machine.

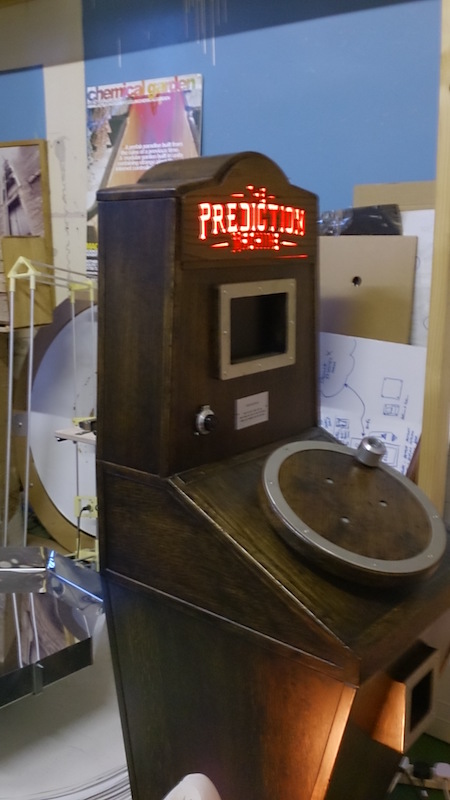
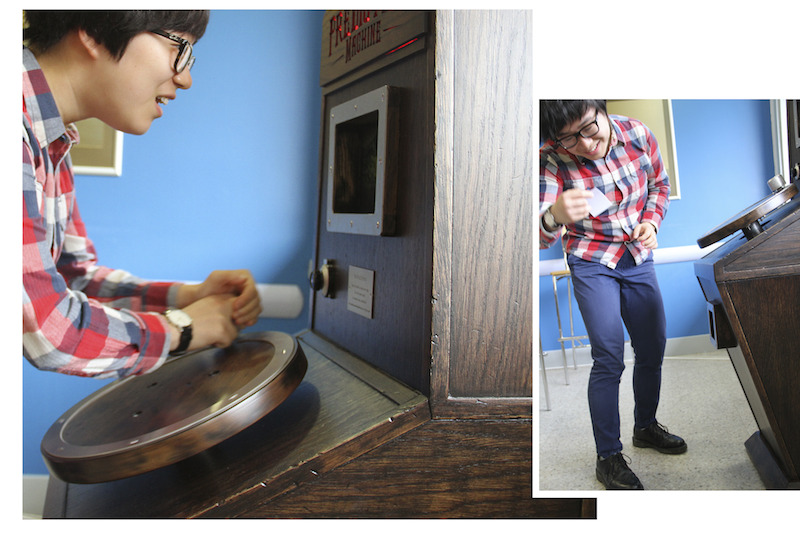
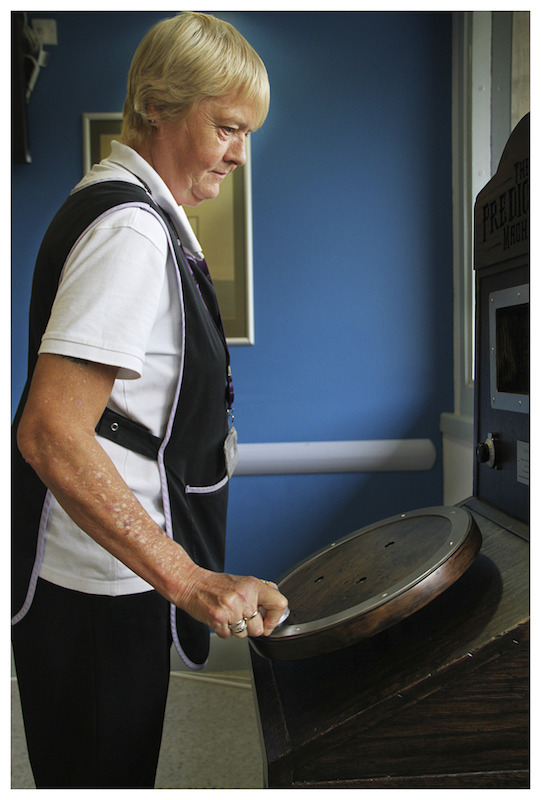
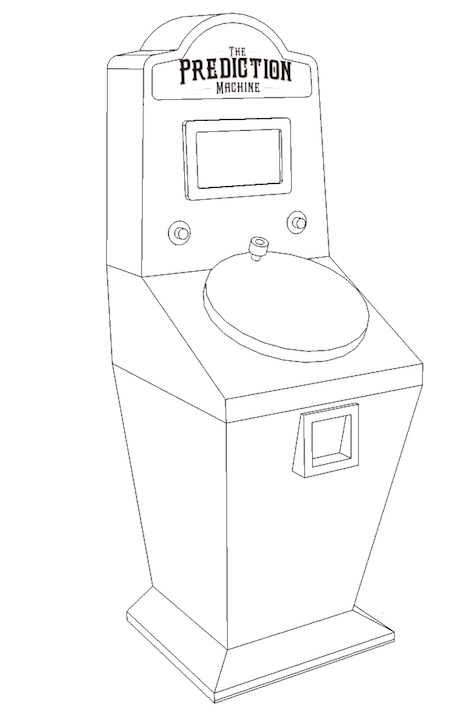
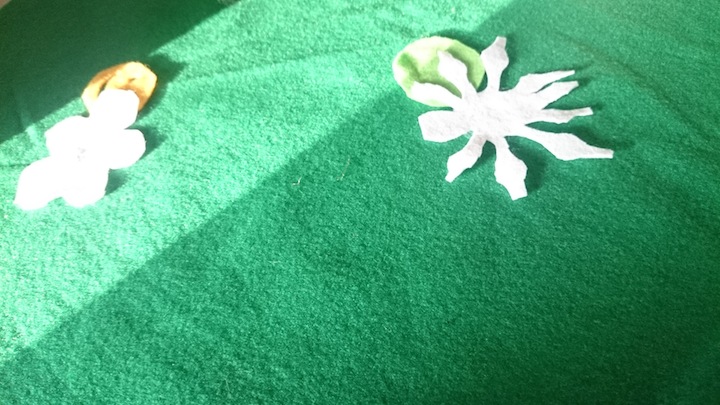
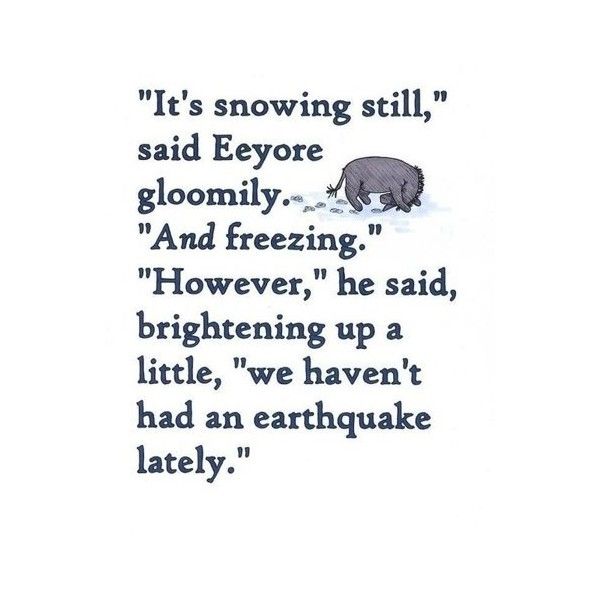
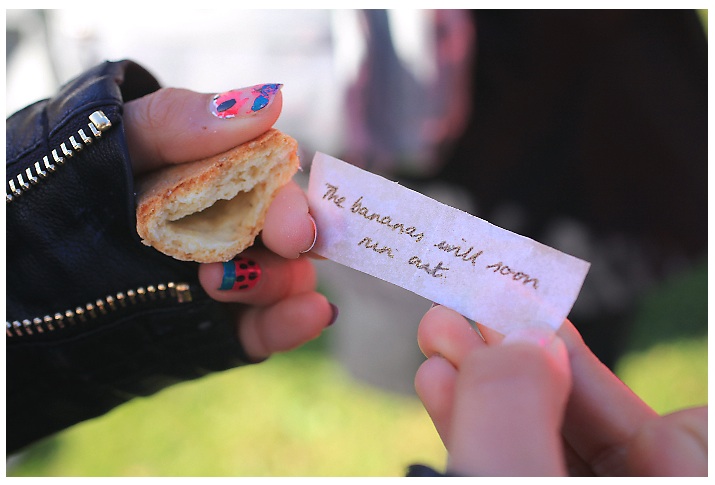
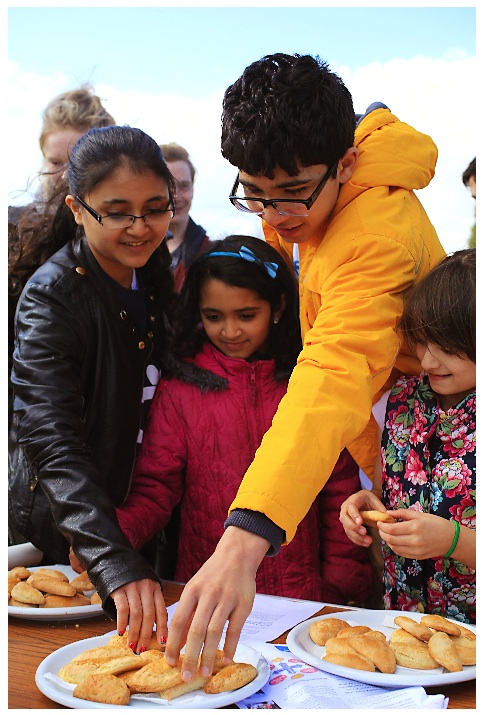
The machine will print out a little prediction. Some of the predictions will be superstitions we have been told or had remembered, to remind us, so we don’t forget as the weather changes rapidly and without sense, some tips that we had heard in the past about growing food, some optimistic sayings and thoughts to keep us positive through the thunder and the heat.

I am building the machine to help us to make sense of what is happening, to give us a sense that there is some sense, help us to accept, help us to prepare, make decisions and choices, to remind us we are humans, who have got where we have got, despite the consequences, through making sense of the world.

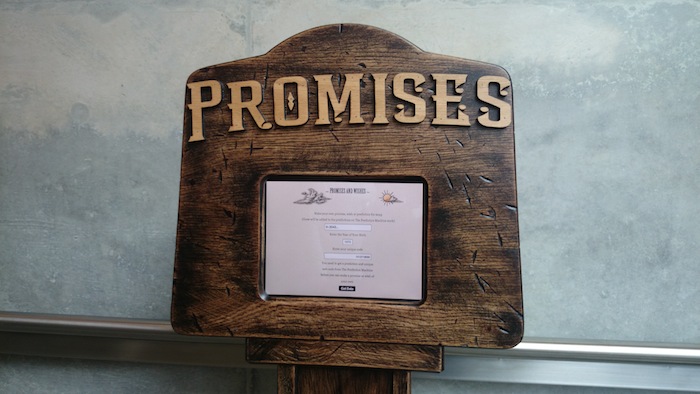
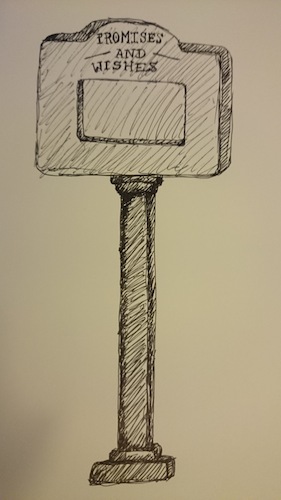
The machine will help predict what is happening in other places and we can send these out, to our friends and family, just in case we get cut off, in the hope that we may somehow be protecting them from afar.

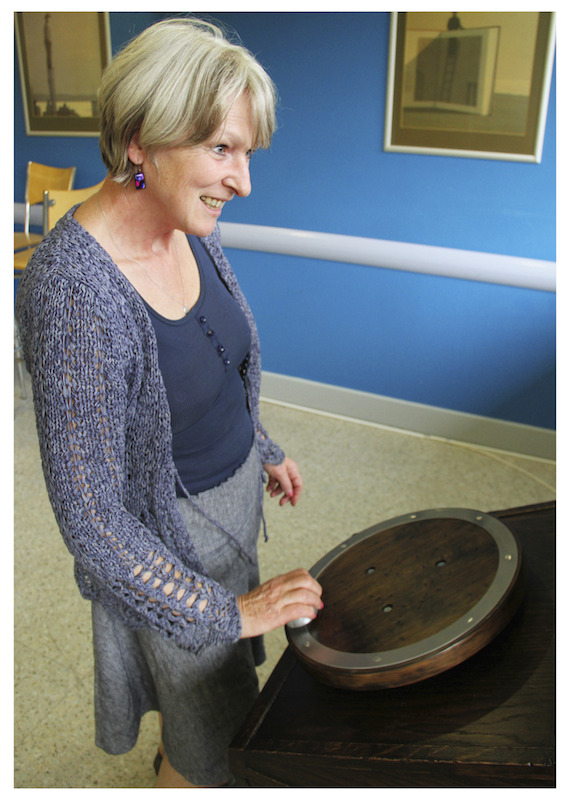
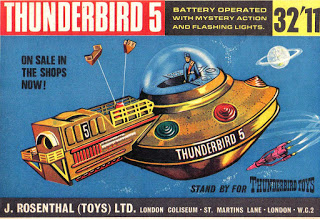
In the future, I imagine we will have a prediction machine in the centre of every town, street or like a barometer on our flood protected walls. To send us warnings, remind us of a climate long gone, track the changes in the weather and try and make sense our new climate.

Sign up to take part and help me build the machine, write the predictions and see if we can capture moments of climate machine over the next six months.

modelling the machine

cardboard model of the machine

I am in the process of building a model of the machine to work out scale, accessibility and design. This will be presented at the Nowcasting launch event at Loughborough University Weather Station on Sunday 23rd March, 1-4pm

The image shows the screen and light up sign on the top. To the right is a hand crank that will power the screen and to the left is the lever to choose whether to print out a prediction for the near future or 20 years time.  The dials let you input your age and what environment you live in (choosing from coast, fields, forests, desert, mountains, town, city) and the hole in the front is where the fortunes come out.

Nowcasting Launch – Sunday 23rd March

Nowcasting Launch - Sunday 23rd March

The Prediction Machine has been commissioned as part of the Nowcasting programme at Radar, Loughborough University.  To launch this event I will be presenting the project on Sunday 23rd March at Loughborough University Weather Station (opposite Pilkington Library) on Loughborough University’s campus, 1- 4pm.

I am baking fortune cookies for the event, asking people to contribute fortunes to the prediction machine and presenting the plans for the machine as a performance about climate change, predictions and uncertainty.

Visiting Loughborough University

jo and matt at the weather station, Loughborough University

Yesterday Matt Little (who is an engineer collaborating with me on the project) and I did a site visit, with Jo Mardell from Radar to Loughborough University and met with Richard who manages the weather station that we are plugging into to control the machine.

It looks like it will be a very simple process to get the data from the weather station into Timestreams which is our platform for managing and authoring data as part of the Performing Data research I am doing – alongside the artwork.

We visited the weather station that captures temperature, relative humidity, wind speed and direction, rainfall, solar radiation and net solar radiation.  It is missing C02 but we are hoping to add this ourselves.

The next big thing for me to do is to work out how to match this live local data with future projections for the area so that we can choose our predictions for the future based on the current weather in Loughborough.  I have been talking to the Dr Carlo Buontempo about this, trying to work out what is meaningful scientifically and how this is best represented by the machine so it is in someway meaningful to whoever is getting their climate fortune print out from the machine.

We looked at possible places to put the machine in and around the campus.  It is a bit of a problem in that we want a place where the public would be comfortable to visit as well as staff and students at the University.  One of the ideas is to place it at different random places around the University,  a bit like Dr Who’s Tardis turning up. In an aisle at the library, in the foyer of the swimming pool, outside the student union.  This would be a bit too much hard work to have to move it and set it up… but also a bit magical.

When I got home I re-watched the beginning of the 1980s film Big, as i love the Zoltar machine in this film (it’s not high art but it works for me).  Really love the lighting up of the instructions and the fact it’s not plugged in.

http://klipd.com/watch/big/your-wish-is-granted-scene

temperature and wind speed sensors solar radiation sensor

the weather station on Loughborough University campus

Ordnance Survey Workshop

BBC screen showing Exploring Places by Active Ingredient

This Wednesday I travelled through the Tube Strike and the floods to get to Southampton for a workshop on mapping at Ordnance Survey.  I was invited to take part I in response to Active Ingredient’s work with mapping through Heartlands (‘Ere Be Dragons), Exploding Places and Love City and my work on ‘performing data’. It was a chance to extend the impact of my research to geographers and mappers and was an interesting opportunity to meet people in other disciplines dealing with some of the same questions.

I was in the ‘uncertainty’ group discussing how Ordnance Survey can represent uncertainty within their data. We discussed many elements attached to this including how OS databases are updated 5,000 times a day. We discussed how the medium of the map enables different assumptions and opportunities to reveal uncertainty in the data – with the majority of OS maps being static there are limited opportunities to layer, play or disrupt the experience of using the map to reveal uncertainty whereas in interactive maps there are many more opportunities to use temporal, narrative and sensory interventions on traditional mapping.

Becoming a doctor

arduino connected to a heat sensor and LED dispay

The last two weeks have been busy and quite amazing.

Firstly I have had funding agreed by the Arts Council of England for the development of the Prediction Machine which is great news, it means that I can properly collaborate with my partners, allocate time to the project in the role of an artist and not just ‘on the side’ of the research and make the machine as I imagine it.

Secondly I passed my PhD VIVA with minor corrections and so subject to these I am now a Doctor of Computer Science which continues to feel like a strange and unlikely thing but it’s also very exciting.

I have also been to London to visit two very interesting exhibitions – firstly the Jerwood Open Forest which was intriguing and very interesting in the light of the work I did in 2011 – A Conversation Between Trees. I was particularly interested in Semiconductor’s work which had a resemblance to our work in the way they captured data over a period of time. The work looks down on the canopy and up at the canopy, using a similar circular form to present the video footage over a year.  They also created a way to visualise the data as we did with our climate machine and heat drawings – their results although static and like graphs were delicate and fascinating.

I suppose what is interesting about comparing the two works is our emphasis on the temporal nature of the data and the desire for some form of liveness in the interpretation of this.  I suppose this is where the concept of performing data stems from – by bringing a sense of liveness, human scale and opportunities to engage in a dialogue around what the data meant, also to reveal the processes of data capture and interpretation. That said there was something very simple and beautiful about these visualisations and physical and tangible in the the presence of the tower that was used to capture the data in the centre of the gallery space.

The second exhibition was the Republic of the Moon which was both moving and playful. I particularly loved the ‘Moonlight Sonata’ that was transmitted to the moon and back and replayed with the gaps created by the transmission, the Colonising the Moon installation which beautifully illustrated a project to colonise the moon with geese and really made me laugh and the incredible images by Leonid Tishkov of his personal, private moon.

Another wierd and wonderful thing I took part in was an Arduino workshop at Nottingham’s Hackspace, only wierd and wonderful because that’s how programming feels to me and also because I was the only female who took part which is always wierd. I made LED’s blink and motors whirl which is very helpful to the machine making going on this year.  It’s good to go back to basics, and now be able to fix stuff the makers I collaborate with have made and understand it better.

Names have been changed to protect the elephants

an elephant and her child

Credit: Meme http://www.meme-elephants.org/meme_home.html

As a result of my previous work with forests in Brazil and the UK I have been invited to get involved with a project in development that is led by the University of Nottingham Computer Science Department in Malaysia.  This project is working with the protection and conservation of Elephants that live in the Malaysian rainforests.

I have been invited out to meet people and elephants later in the year, very exciting.

This invitation was a result of Active Ingredient’s project ‘A Conversation Between Trees‘, particularly the way that we combined the artwork and schools activities. Hopefully it will provide another opportunity to explore how the concept of ‘performing data’ can be applied to measurements of ecology and conservation, how artistic strategies can support engagement, shifts in perception and action in response to scientific data – and with Elephants – who are pretty engaging all on their own!

Performing Data

visualisations of trees in a forest in the UK and Brazil

Performing data is a concept that has arisen as a response to the ways that the artists bring data ‘centre stage’ within their artworks – employing performative and temporal strategies to provoke emotional responses to the data.

‘The visualisations provide a conversation not only metaphorically between the trees and locations, connected by the two sets of mobile sensors but also across different temporal zones, enabling the public to experience forest environments as an evolving, moving landscape that changes over time.”  (Jacobs and Shackford, from the Material Conditions Publication)

“The drawings produced by the Climate Machine physically fill up the space as time passes, you wouldn’t get this sense of accumulation through a scientific graph, a screen or projected image.” (Jacobs and Selby, from the Material Conditions Publication)

paper discs with C02 data hanging from the ceiling behind the climate machine

This concept of ‘performing data’ was extended through the development of the Timestreams platform and defined as:

  • Data that can be replayed or experienced live in real time and real physical space
  • Data that can be used to create and control sensory, embodied, immersive experiences and mechanical and electronic artefacts, in order to represent a meaningful narrative based experience (replayed or live) of the data
  • Data that is remediated as sensory, embodied, immersive and mechanical time-based artworks


setting up a timestream

“performance is there in terms of the way we make the data perform or that we create a situation where the audience can influence what’s going on… kind of feedback loops between the audience, the experience and back to them and so either they are actively taking part in it or they become active performers” (Watkins, 2012)

inflatible sculptures controlled by decibels and C02

‘The Prediction Machine’ will explore how performances of data can occur both through the interaction with a machine that tracks climate data and marks moments of climate change, through printing out a narrative devised in collaboration with artists, scientists and the public. This will then directly inform an ‘action’ to mark these climate change moments. This will be a public performative event that will be informed by and in response to the data.

Links to other projects and research

burning forecast C02 data as circular graphs

As I conduct my research I will try and bring together works by other artists who use climate data in their work as well as research, papers and interesting stuff that relates to the project.

Previous Related Work by Active Ingredient:

A Conversation Between Trees
www.hello-tree.com

Timestreams
www.ai.timestreams.org

Some Related Artworks:

Andrea Polli
http://eyebeam.org/hello-weather

Natalie Jeremijenko
http://www.environmentalhealthclinic.net/ooz/projects/xspecies/
http://www.massmoca.org/event_details.php?id=29

London Fieldworks
http://londonfieldworks.com/projects/polaria/index.php
http://londonfieldworks.com/projects/spontaneous-city/index.php

Jane Prophet
http://www.janeprophet.com/2011/09/sculpture-tank-vitrine-crystal-crystalline-time-slice-2006/
http://www.janeprophet.com/2011/09/art-installation-australia-light-cables-counterbalance-2007/
http://www.janeprophet.com/2011/09/heritage-fruit-tree-apple-hanbury-hall-art-installation-site-specific-souvenir-of-england-2007/

Autogena
http://www.autogena.org/mbs.html
http://www.autogena.org/globe.html

The Owl Project
http://owlproject.com/flow

Jerwood Open Forest Commissions
http://jerwoodopenforest.org/
Juan delGado
Adam James
Amanda Loomes
Semiconductor (Ruth Jarman and Joe Gerhardt)
Chris Watson collaborating with producer Iain Pate

Noel Murphy
Helioscillator
http://www.visualdisplayunit.org/helioscillator-project/

Background to the project

farm

The Story of The Prediction Machine

The Prediction Machine was developed during the Relate (Timestreams) project that took place in 2012, in collaboration with the artist and designer Mark Selby and as part of my work with Active Ingredient. This project came out of another project I worked on with Active Ingredient – A Conversation Between Trees and before that The Dark Forest. We’ve been thinking about forests and sensing the environment for quite some time it seems.

I sat with my colleagues in Bestwood Park, a forest on the edge of the city of Nottingham on a sunny summers day of 2012 and we planned a series of artistic experiments that looked at the theme of energy and climate change that was the theme of the larger research project we were commissioned to work on by Horizon at the University of Nottingham.

Sitting amongst the bugs and trees in an English forest we talked about how the seasons are changing and what that might mean for our culture, for our folklore, for Shakespeare and the poets who talked of seasons changing as metaphors for ageing, emotional turmoil and as a fixed concept ‘as surely as the seasons will change’.

But what if they don’t? What if they move about and Summer becomes Winter, Autumn and Spring act the same. We are starting to see wet seasons, stormy seasons and heatwaves that hardly correspond to our ideas of the seasons – and this is in England where we expect it to go from rain, sun and storm in one day.

Out of this conversation the idea for a machine that predicts extreme weather was borne. Something that was playful, something like the old arcade machines. The idea that weather forecasts and climate predictions are like horoscopes, that merges folklore, hearsay, scientific data and knowledge from climate science.

The first prototype of the machine and the fortune cookies were made when we spent a week on an artist residency on a farm (owned by the performance company Zecora Ura/Gargarullo) in the mountains of the Mata Altantica, Brazil.  It took 2 hours to walk from the bus stop, through forest and agricultural land to the farm. Nothing could be seen from the farm but forested and deforested hills.  As the storms rumbled in from the Atlantic Ocean the monkeys in the trees grumbled, the forest managers told us that when the monkeys made noises the storms were coming.  We kept an eye out for the Pumas roaming in the forest around us and the snakes hidden in the banana trees, we were entranced by the birds (hummingbirds waking us up in the morning), fireflys and their magnificant displays as we walked to our rooms at night.

I interviewed the artists on the residency and the forest managers who were the only other people for miles around about their weather predictions, why they made the predictions and what would happen if an extreme storm arrived.  We looked at weather and climate data on the intermittently connected internet and saw that the temperature of the Atlantic ocean was heating up every year, we saw that a storm was predicted in North America and the Carribean (it turned out to be Hurricane Sandy).

I imagined what it would be like if a storm came and left us stranded.  These thoughts in November 2012 are sadly closer to reality now in January 2014. Within two years many extreme weather events have cost lives, disruption and effected millions of people around the world. There is a bit of me that wonders if my Prediction Machine is too late – surely we all now know about Climate Change – and we are seeing it in the storms and heatwaves now.

But the scientists still need evidence to say ‘yes – this is a climate moment’ and we all get on with our lives, finding it hard to perceive risks in every car ride, flight, consumption moment we are complicit in. Dr Bountempo explained to me that humans are not built to deal with long term, multilifespan, global risks. Maybe we only act when we are at the point of fight or flight.

So lets see what happens, if people feel that they have experienced climate change, how do we mark it? How do we bring this into our everyday lives and understand the threats and risks and act accordingly?

Hereinafter called the scientist

fortune empadhinos
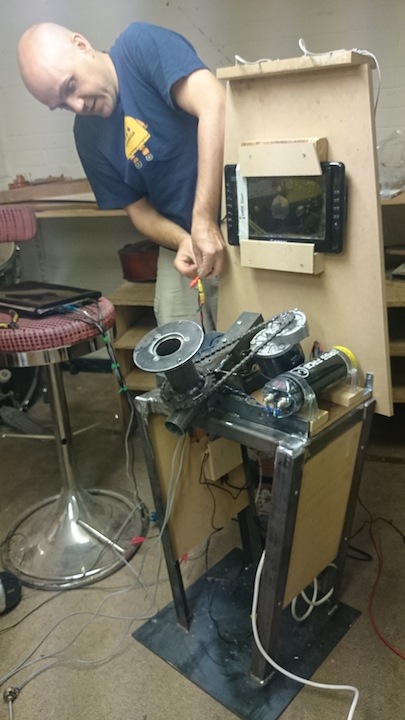
hello. I am starting a blog to record how I have become an artist/scientist, the research I will be doing this year and to talk about The Prediction Machine – my new artwork.

The Prediction Machine was developed as a prototype when I visited Brazil as part of the Timestreams project in 2012. This was a large artist-led project that I was involved in through my work with my artist collective Active Ingredient and Horizon Research Institute at the University of Nottingham.

Since that project ended I have completed my PhD thesis (pending VIVA) and won an EPSRC Doctoral Prize for Impact from the University of Nottingham to continue my research.

It’s all very exciting, and possibly what excites me most at this stage it that my contract calls me ‘the scientist Rachel Jacobs’. I suppose they might be right to say this now that I have done a PhD in Computer Science – but from someone whose only previous science training was scraping a C in Biology GCSE this came as a bit of a shock and an interesting professional identity shift. I have delibrately chosen to place my research in an interdisciplinary context and my PhD looked at where contemporary art, HCI (human computer interaction) and Climate Science meets… but this is a very new thing to me being called a scientist.

But here I am doing a part time impact fellowship at Horizon and the Mixed Reality Lab at the University of Nottingham.

The research: looking at the impact of artists working with climate data (and there is increasingly many artists working in this area – unsurprisingly as Australia burns and overheats, huge lumps of warming ice drift out into the ocean, super storms rage across the warming seas and hitting land at fatal speeds and the US is consumed by a polar vortex that supposedly freezes eyeballs – not to sound too apocalyptic about it all).

Alongside this impact fellowship thing I am continuing to be ‘an artist’ but this time i’m going solo, sort of, still collaborating with some really wonderful and exciting people but for the first time in 17 years I am making an artwork under my own name and not as part of my collective Active Ingredient.

The artwork: An ‘end of the pier’ arcade machine that predicts climate fortunes as part of a project to mark and understand ‘moments of climate change’ that we might experience in our everyday lives – snow on a summers day, hurricanes and floods like we’ve never seen, in places we would never expect, 3 months of drought, the apple tree that has begun to blossom and fruit at the same time.

More on both to come…

The image above is of some fortune cookies I made when I first developed the idea of the Prediction Machine. They were made to look like small sweet Brazilian Empadhinos (a type of pasty) but had written fortunes inside that were devised from interviews I did with artists and forest managers in Brazil. Prototyping an interactive artwork as a cake test was quite interesting, the technology wasn’t in place at this stage to test the concept so I choose to move to baking in order to play with the ideas of mixing fortune telling and climate change predictions.

One of the audience members who saw the prototype of the Prediction Machine exhibited as part of the Timestreams project said that finding climate change predictions in a sweet cake had a very strange effect, eating a nice sweet thing whilst being delivered bad news.