We are nearly there with the first test of the machine – due to take place next week.
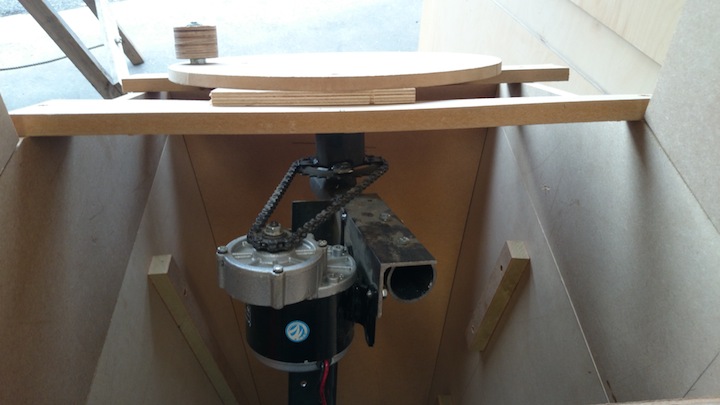
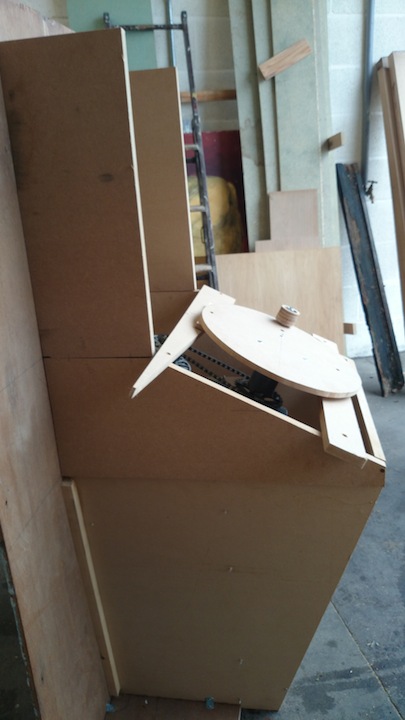
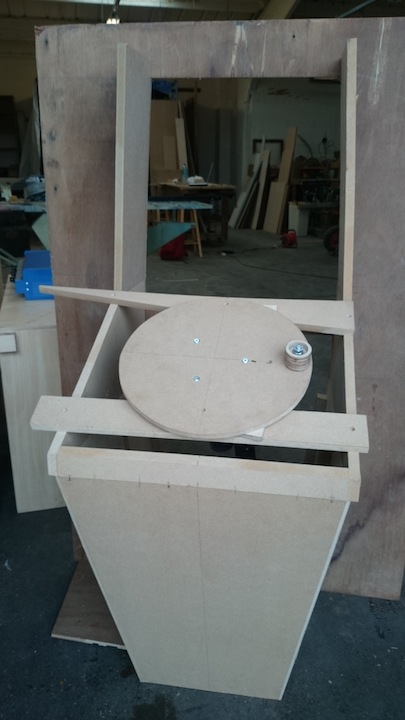
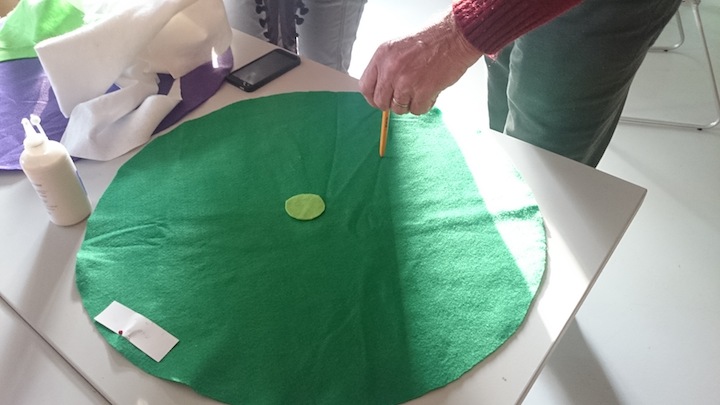
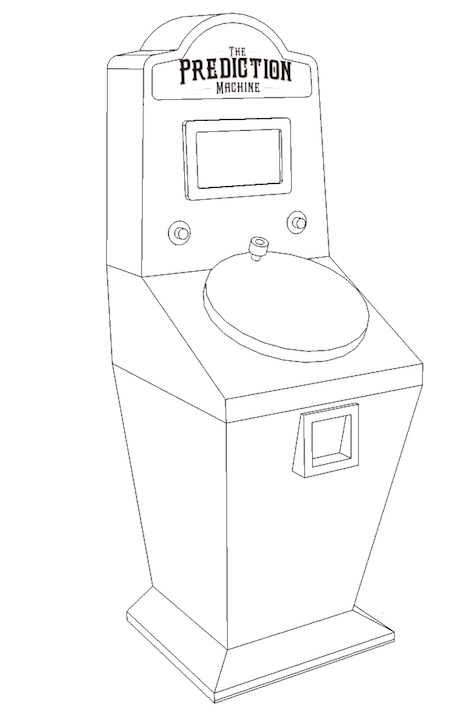
Ian Jones (Sherwood Wood) is the brilliant carpenter who is building the machine with me and Matt Little is the equally as brilliant engineer who is building the guts and functions of the machine. So far we have a mock up of it’s basic functions in MDF and the metal frame is being made ready for next weeks test. We have also been working on the finishing, panelling and metal decorative bits to finish it off. It needs to looks like it has travelled through time and space and all weather to get to the place it gets to (like the Tardis in Dr Who) but that it is highly technical, with an added hint of magic.
Next week we will hopefully be testing the machine’s functions from end to end…
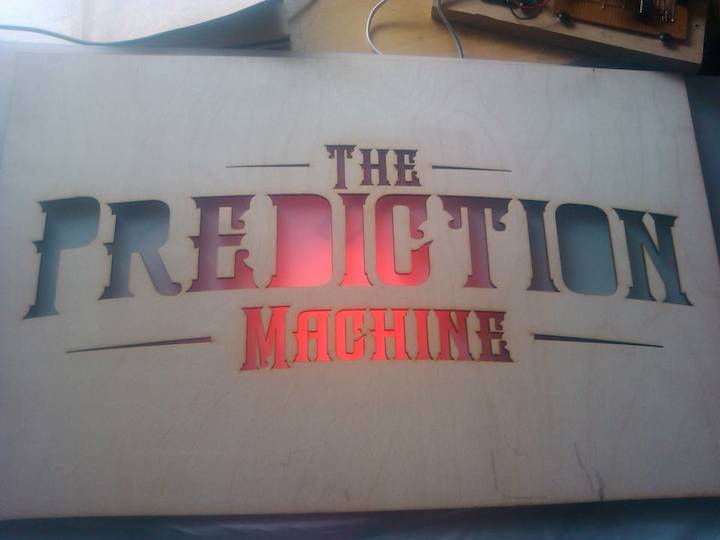
1. Testing the sign controlled by temperature readings from the weather station
2. Testing the hand crank and video controlled by precipitation (rain)
3. Testing the printer with future weather scenarios for 2044 and a webcode that will enable people to type in the code here on the website and see explanations about how the predictions were made
Testing the sign
The sign at the top of the machine will light up, the lights increasing in intensity based on the live temperature from the weather station. When an extreme weather scenario occurs (based on live temperature, precipitation and wind speed) occurs then the sign will pulsate.
Testing the hand crank
The hand crank enables people to power the machine with their own energy – when the crank reaches 12 watts the screen powers on and ghostly faces appear, voices crackle into life and a message is transmitted disrupted by the weather data. Precipitation, temperature and wind speed data break up the video, the more extreme the weather the less able you are to hear and see the message.