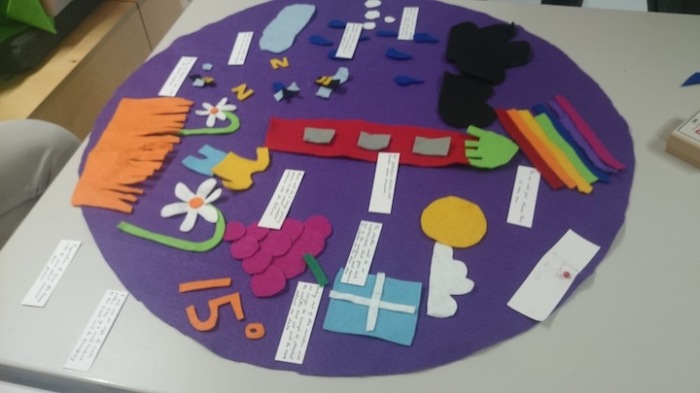
Modelling Climate Change
Climate Scientists create models to project how the climate might change in the future, based on what they see happening to the climate now and in the past.
The predictions used in this artwork – for a fictional 2044 – have been calculated using a very simple model. The model uses live temperature from a weather station at Loughborough University, it then adds the projected increase in annual average temperatures for Central England (estimated within a 30 year range from 2040 – 2069).
These calculations are for a future dominated by consumerism and globalisation – that the scientists call a high emissions scenario – where C02 continues to increase in the atmosphere due to our ongoing use of fossil fuels (oil, coal, gas etc…). In this case the temperature is projected to increase approximately 3.7 degrees centigrade over the period of 2040 – 2069. Future versions of the machine will use a more complicated climate model, in order to represent a more complex picture of how the climate might change in 30 – 50 years time.
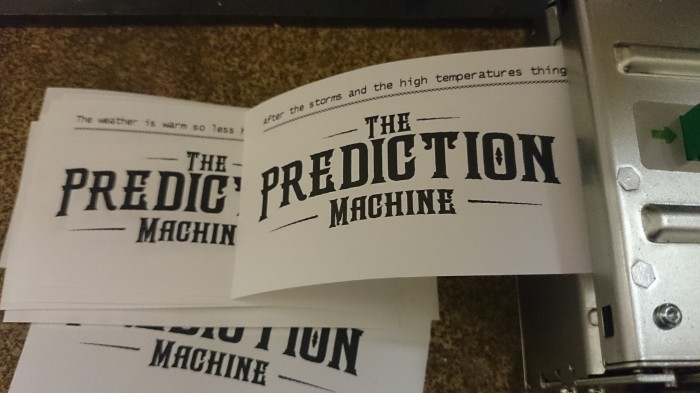
Please note that The Prediction Machine has been informed by scientific climate and weather data but interprets this data through dialogues with communities and scientists in order to give us a sense of how today’s weather might feel in the future, it does not aim to create a scientific climate model. The predictions have been written by people who live and work in Loughborough in response to climate data, through their own interpretations and taking part in workshops with the artist. The Prediction Machine therefore enables us to reflect on how we perceive climate change in our everyday lives – rather than a scientific experiment.
To explore the MET office graph showing a full set of projected temperatures for Central England with different emissions scenarios for 2040-2069 for yourself click here
What Do We Mean By Climate Change?
The Prediction Machine focuses on human made climate change.
Climate Change is most commonly talked about in relation to human made (anthropogenic) changes in the earth’s climate (Norgaard 2011; Washington 2013; Wrigley 1999; O’Hare et al. 2005). There are differences between the terms ‘climate change’ and ‘global warming’. Climate change relates to a broad definition of the Earth’s climate, whereas ‘global warming’ focuses on the Earth’s ‘increase of temperature over time’ (Boykoff 2011). Global warming can be seen as the ‘fingerprint’for human made climate change (Wrigley et al. 1999).
The anthropologist Norgaard suggests that there are two basic facts that we need to be aware of in order to understand issues of anthropogenic (human induced) climate change:
‘if global warming occurs it will be the result primarily of an increase in the concentration of carbon dioxide in the earth’s atmosphere… the single most important source of carbon dioxide is combustion of fossil fuels’ (Norgaard 2011)
There are ongoing discussions about whether and how we can focus on putting less CO2 into the atmosphere (mitigation) or dealing with the consequences (adaptation) – or hopefully – both.
To see a visualisation of how the climate has changed in Central England over the last 100 years and since you were born click here
Weather and Climate
Climate is different from weather. Climate is the patterns and trends of weather in the Earth’s atmosphere that are measured over a particular region, or globally, over a long period of time (typically 30 years). Weather is what is happening in a particular place, at one moment and over a shorter period.
The Prediction Machine plays with our ideas of climate and weather, it uses climate data (a projection of long term temperature trends for a 30 year period) to give an impression of what the weather and our world might be like in the future, as a result of the climate changes projected by scientists. This is a common if not over simplistic way to model how climate change might affect us in the future and has been developed in dialogue with several climate scientists who have advised the artist throughout the development of the project.